Supply Chain Intelligence (SCI)

WHAT IS IT?

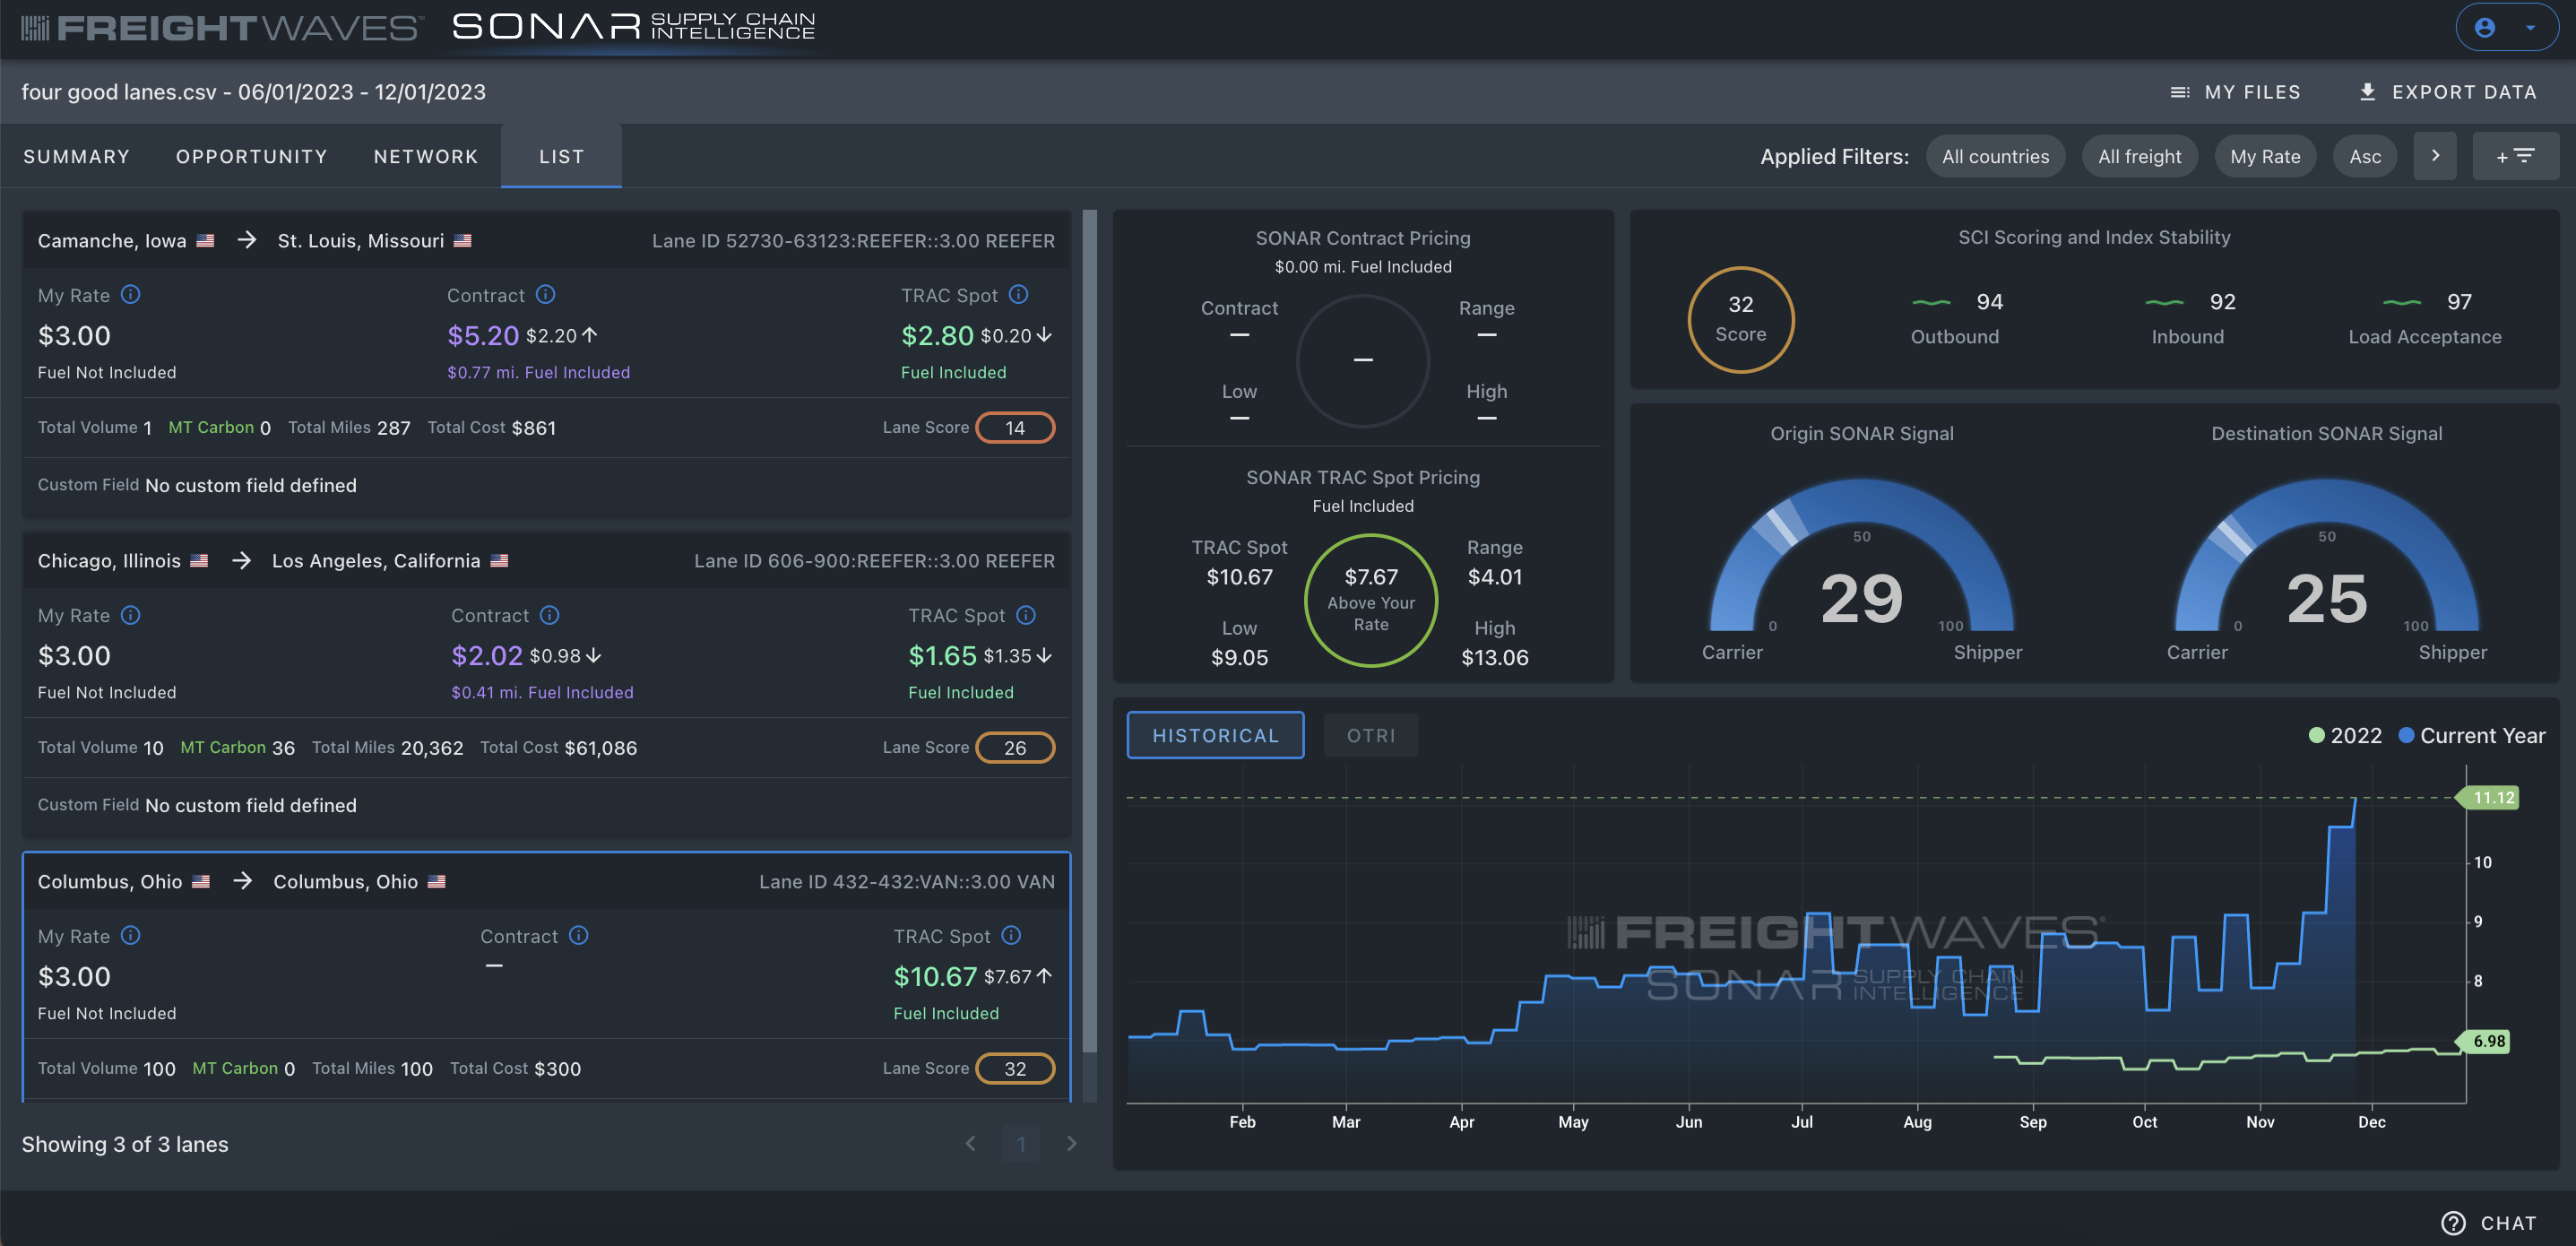
SCI provides insights into market stability, by lane, helping participants identify TRAC Spot and Contract rates and capacity risk on a lane. It also gives users the ability to quantify the carbon impact of their transportation networks.

This tool also provides a measure of lane coverage favorability via the Lane Score, which evaluates multiple data points within the app. Think of it as a volatility score for a given lane, throughout the year, determined by historical tender activity and rate volatility. The higher the stability score, the more consistent the rate and capacity are on a given lane, resulting in a consistently high rate of tender acceptance. The lower the stability score, the more likely a given lane will experience routing guide instability.

The scores, analytics, & insights in SCI come from a combination of tender activity, TRAC Spot rate consortium and historical contract rate transactions. The contract rate data has been collected over a 4 year period from a pool of $80 billion worth of actual paid contract rate invoices.
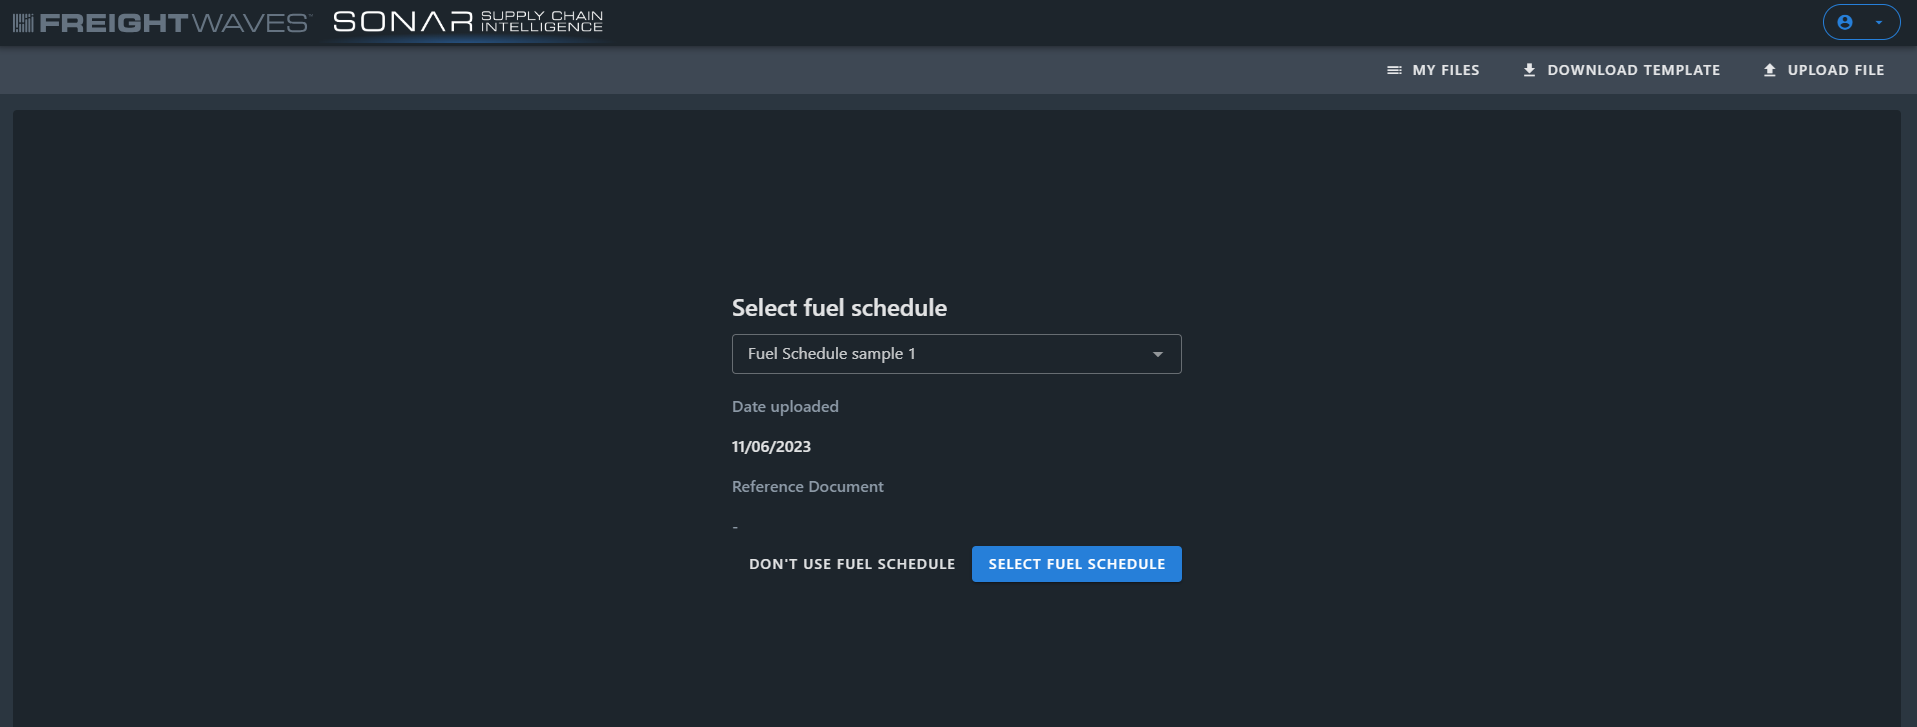
Fuel Schedules : 

Fuel schedules are meant to provide users with the ability to incorporate custom fuel surcharges into their rates when doing a benchmark analysis of their lanes.

Selecting a Fuel Schedule

  • Once a Fuel Schedule(s) has been uploaded to an Organization, there will be a new step in the benchmark analysis workflow after the analysis date range is entered prompting you to select a Fuel Schedule to use in the analysis.
  • Using a Fuel Schedule is optional even if there are Fuel Schedules associated with the Organization. If you click ‘Don’t Use a Fuel Schedule’ the remaining steps will be skipped and your analysis will be started. When viewing your analysis in the application, you will see ‘Fuel Not Included’ beneath your rate and the ‘My Fuel Cost’ columns in the data downloads will be blank.
  • All active Fuel Schedules will show up in a drop-down list (sorted alphabetically) to choose from.
  • When a Fuel Schedule is selected, you will see the date is was uploaded and (if one exists) the reference file which you can click on to
    enlarge and download.

SCI accurately predicts when and where routing guide failures are likely to occur.

WHAT DOES IT TELL ME?

SCI shows multiple benchmarking, volume and rate across a set series of lanes based on historical paid invoicing data and real-time data. This lane-level intelligence provides insight into specific markets, origin/destination stability and contracted/spot rates to inform short-term RFPs, networking decisions, identify the most actionable lanes where CO2 emissions can be reduced and more. This combined helps enterprises identify issues within existing bids, recognize the contributing factors affecting lane stability, apply seasonality and accessorials.

SCI generates more strategic improvement goals, particularly mini-bids and capacity procurement, by the continued use of tactical (in-action) moves versus strategic (pre-planned) moves across the unified, digital and collaborative transportation network. Now, users can upload their data to tap SCI insights day or night. Additional implications include RFP strategy, knowing when to onboard new carriers, new lanes, hire more drivers or plan next distribution center sites.

This tool further provides current insight into the Historical Truckload Rate Data via the visual ticker and the current Outbound Tender Rejection Index for that specific lane’s origin.


WHO IS INTERESTED?

  • Shippers are interested because SCI provides protection and ensures they are running profitable lanes. By doing so, shippers are more likely to stay on budget with their yearly transportation spend while increasing capacity procurement. Shippers can automate the calculation of a significant portion of their Scope 3 carbon emissions using granular transportation data and rigorous carbon accounting methodologies.
  • Brokers can use SCI to help predict stability and longevity of rates within the market, and determine whether the lane should be quoted. Knowing the trends of the lanes can help widen their margins.
  • Carriers will be able to see inbound and outbound stability on specific lanes. That helps with planning asset allocation and assessing current pricing structures.


HOW TO USE IT

The video below will give you a step by step tutorial on how to fill in the template for SCI.

For the full SCI 101 tutorial – please click here.


Search Knowledge Center

Discover all that Supply Chain Intelligence (SCI) has to offer.

KC-Icon-App-SCI-Network

Network View

KC-Icon-App-SCI-List

List View

KC-Icon-App-SCI-Opportunity

Opportunity View

KC-Icon-App-SCI-Summary

Summary View

Choose Another App

download-17

Container Atlas

KC-Icon-App-Critical-Events

Critical Events

KC-Icon-App-Market-Dashboard

Market Dashboard

lane-scorecard-icon

Market Dashboard+

container-atlas-icon

Most Volatile Markets

imports-by-consignee-icon

SONAR Charts

KC-Icon-App-SCI-Summary

SONAR Maps

predictive-rates-icon

Watchlists

Not Sure Where To Start?