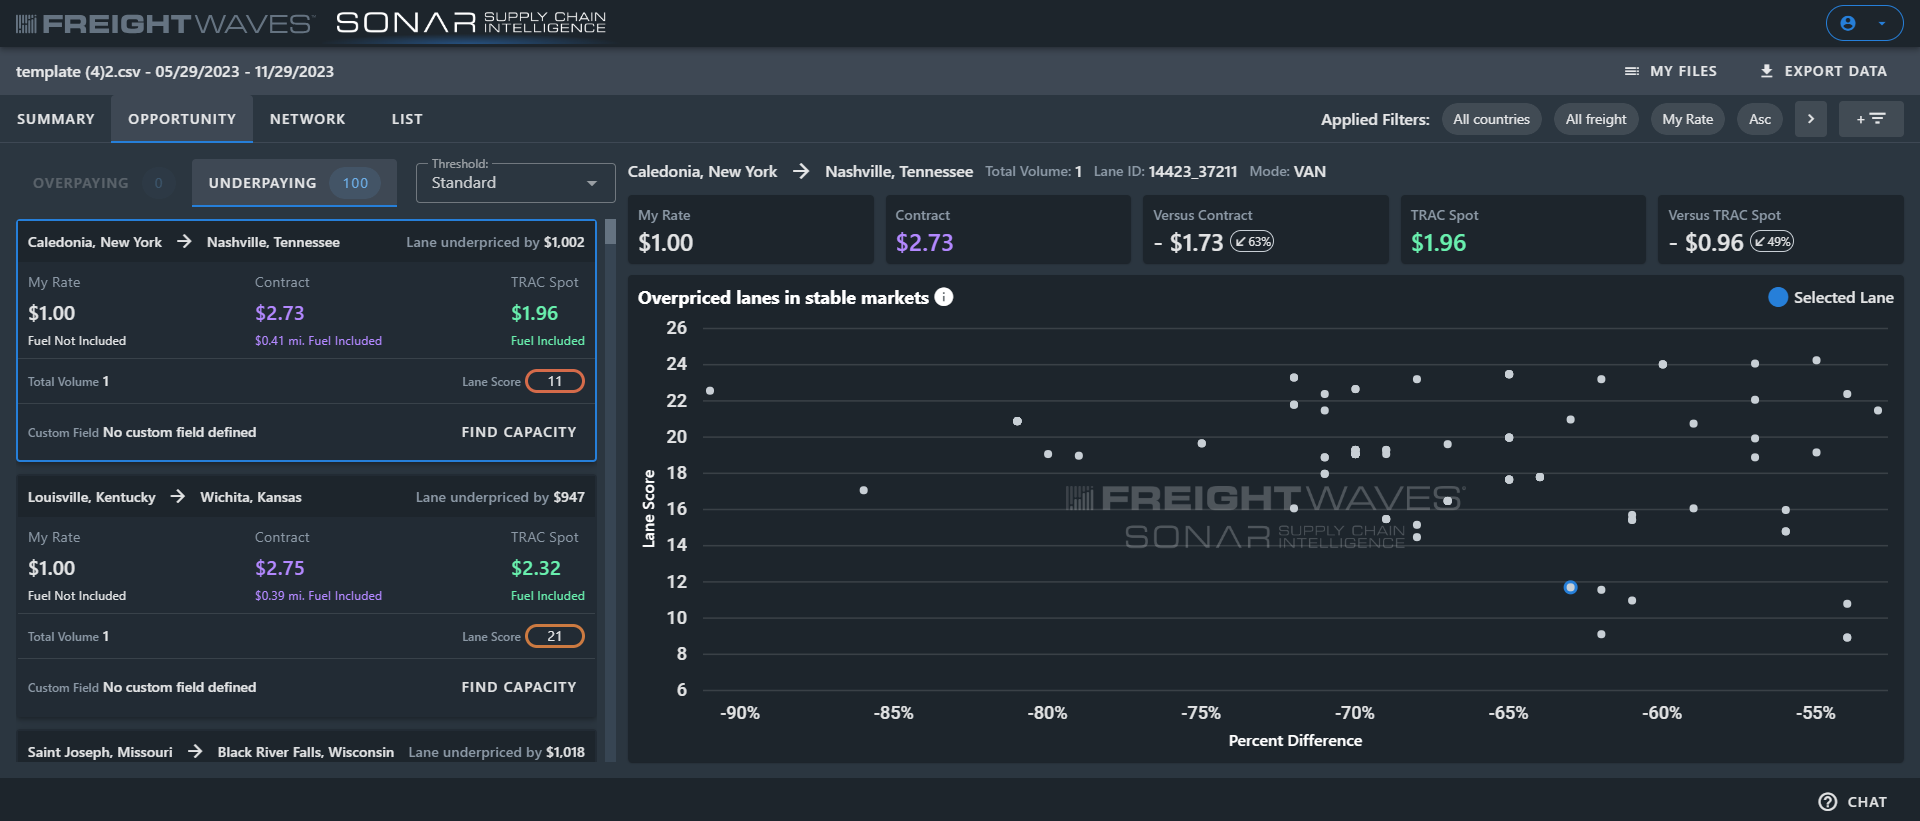
A page that lists all the lanes that are identified as priced above the market in which conditions are favorable for negotiating lower (Overpaying) and lanes in which the benchmark or user uploaded rates are below market and conditions are favorable for low carrier compliance (Underpaying). The page is divided into two sections with lane detail on the left side and a scatter plot on the right.
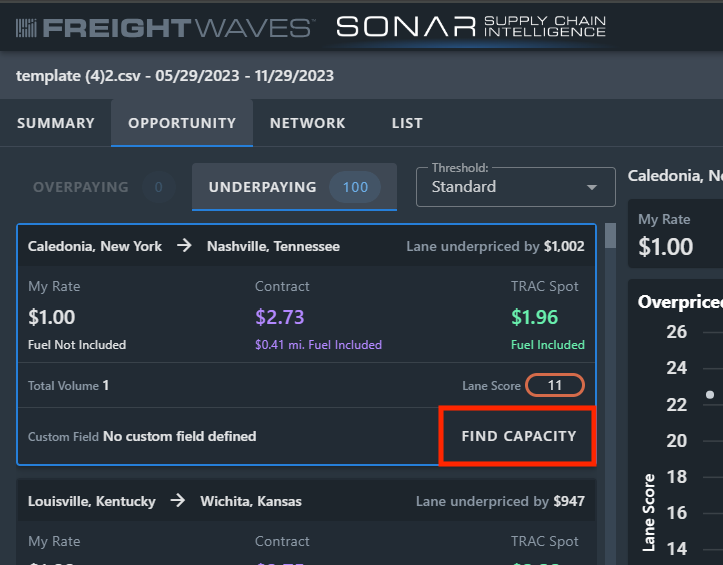
The lane detail section displays the lane origin and destination with user-identified benchmark rate, a market rate that comes from FreightWaves’ contract rates database based on the desired timeframe, and the TRAC Spot market rate from our TRAC consortium.
The scatter plot shows the lane score on the Y-axis and percent difference from the peer rate on the X-axis. Overpaying lanes will have lane scores above 60 paying 10% above peer rate; while underpaying lanes will have lane scores below 25 paying 10% below the peer rate.
The Find Capacity allows users to quickly see brokers and carriers who have ran that lane recently.