We’re here to announce more improvements!
Mexico Contract Truckload Volume Data
The SONAR team is excited to announce 13 new contract truckload volume indices! You can now see how volumes are moving in either the northbound or southbound direction between the United States and Mexico at a national level, as well as volumes moving within the country of Mexico. Both granularities, northbound and southbound, are then divided into five lengths of haul-based tickers.
This new data will show you the amount of trade and deficits between the two countries, providing insight into how your pricing and capacity commitments could be affected. Changes in the direction of moving volumes indicate when rates will be driven higher (northbound volume increases relative to southbound, or exports) or lower (southbound volume increases relative to northbound, or imports).
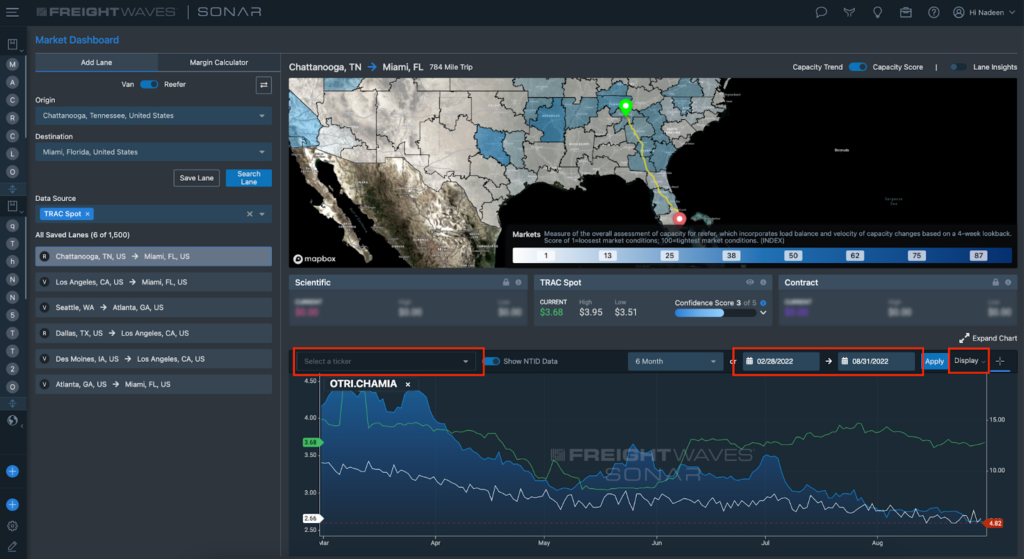
In the chart below we are looking at the Northbound Mexico Truckload volumes (MEXVOL.MEXUSA) in blue vs the Southbound Mexico Truckload Volumes (MEXVOL.USAMEX) in pink. Both datasets have been showing a decrease in volumes since March/April of this year. With the increase in import volumes we are seeing from China to Mexico we should start to see the Northbound volume level off or even increase as those imports arrive to the manufacturing facilities and are transferred into truckload volumes.
For the full list of tickers and more information, click here and as always, if you have any questions or feedback, please contact your customer success manager or email [email protected].
We’re here to announce more improvements!
As our Future of Supply Chain Event in Atlanta comes to a close, we have a number of new features and updates that were announced live on stage. Some of these updates are ready for you to access now and others are coming soon! As always, if you have any questions, we are here to help.
Export the data you need with the new Excel Add-in
For those who need the ability to analyze and aggregate data via spreadsheets, we are excited to announce the new Excel Add-in feature that allows customers to choose the data they need — without the need to know code or get IT teams involved. Transportation analysts and pricing teams will love the ability to choose the data sets they want to view and streamline the aggregation and analysis of it for enhanced efficiency.
In case you missed the 5/23 updates, we also released:
Coming Soon Q3 2024
As always, our customer success team is available to discuss these new features and products, but we hope you find this high-level overview helpful. If you have any questions, please contact [email protected].
We’re here to announce more improvements!
Welcome to our latest and 3rd round of SONAR releases this year! We are thrilled to be able to announce some exciting updates for both our TRAC users and the broader SONAR customer community. From improved search capabilities to AI-powered forecasting, this batch of releases truly has something for everyone.
TRAC KMA Forecast
Your team can have more confidence than ever in bidding spot loads thanks to TRAC KMA Forecast. This unique feature uses historical data along with current patterns and trends to create the most accurate dry van spot rate projections. Leveraging AI specifically tuned for time-series forecasting, TRAC KMA Forecast simultaneously predicts thousands of lanes’ rates on a daily basis. Users can access daily rates up to one month in advance or weekly rates up to one year in advance, helping to offset financial risk and understand how rates will likely shift during that period for optimal planning. Available via API.
myTRAC Now Available
(exclusively for TRAC contributors)
For those contributing data to the SONAR Trusted Rate Assessment Consortium (TRAC), benchmarking just became far easier. myTRAC now enables users to compare their rates to the current market to identify opportunities for cost savings and help inform their rates — currently available in the UI only. Easily identify lanes where you should be paying more or less, and gain helpful context to plan effectively and optimize your margins.
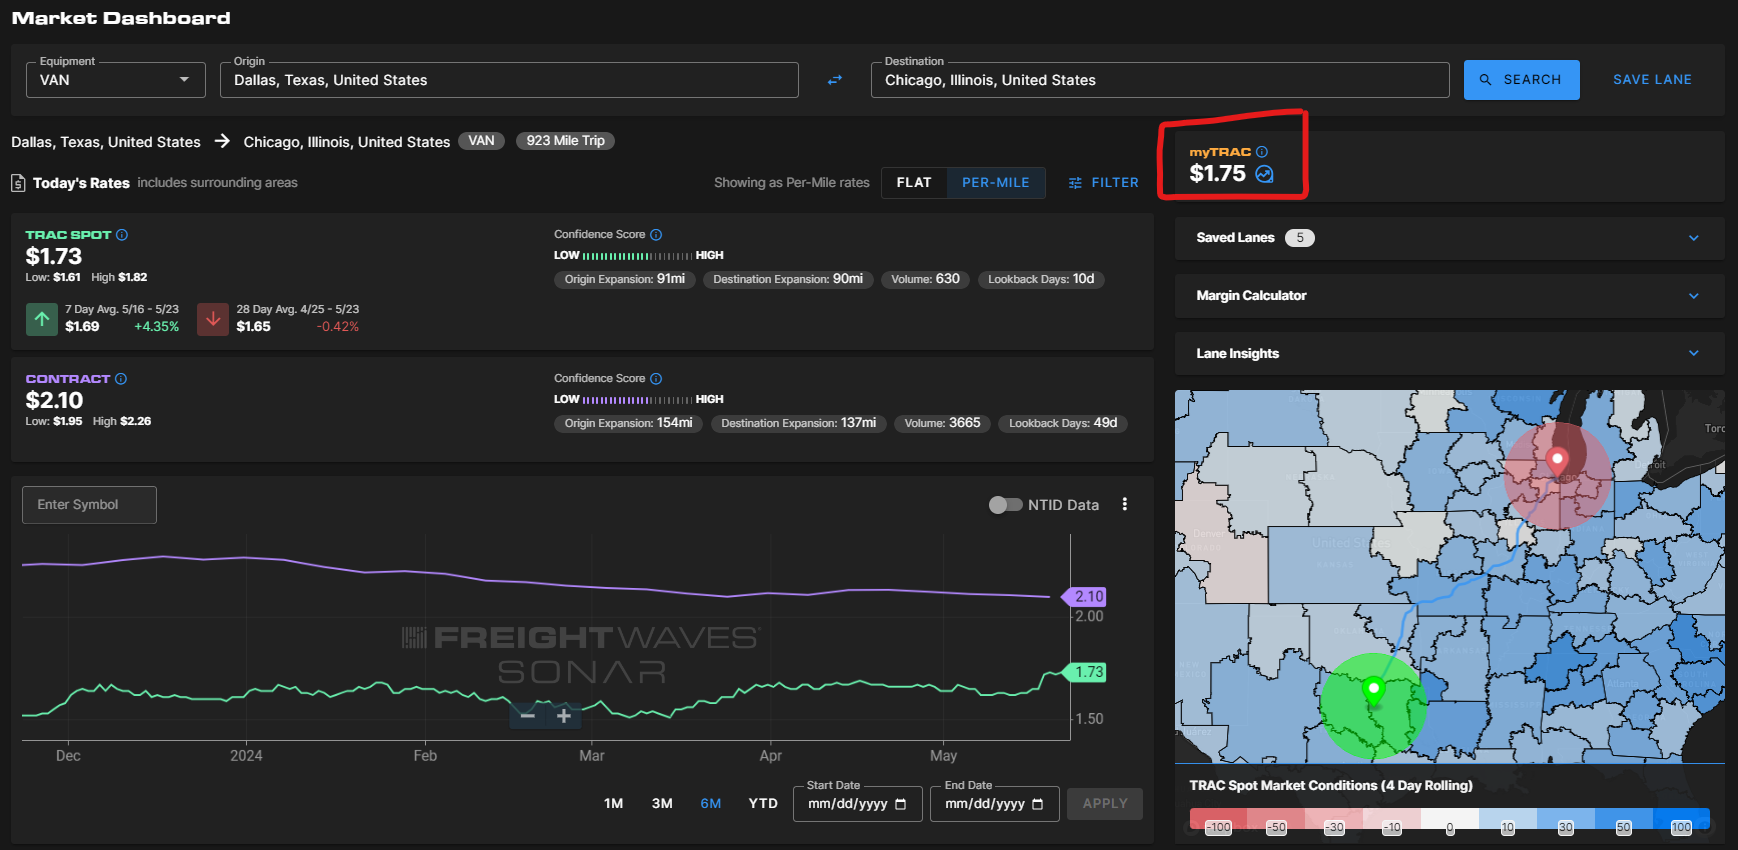
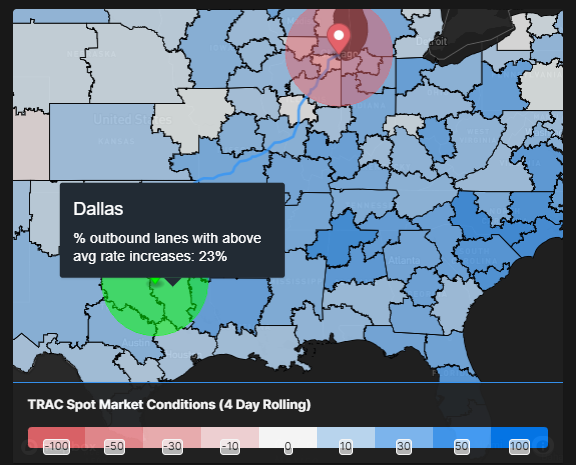
Market Conditions in Market Dashboard
Imagine being able to look at a map and immediately understand where rates are most volatile…and now pinch yourself because this is your new reality. Market Conditions provides a heat map of markets where rates are either increasing or decreasing more often so that you can adjust pricing and budget accordingly. Markets in red have looser capacity (and therefore lower rates) while markets in blue have the majority of the lanes with increasing spot rates, allowing users to get a sense of market conditions and rate trends at a quick glance.
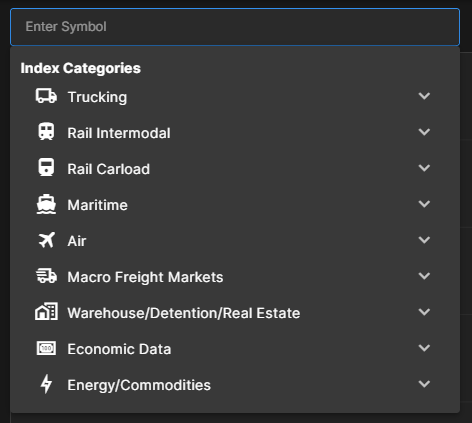
Ticker category search enhancements
Our data engineering team has worked to streamline the process of finding the tickers you need by consolidating from 24 categories to eight. Users will benefit from enhanced ease of use and being able to more quickly access the data you need.
More on the horizon
The product roadmap is full of excellent improvements, features and more that will add value and improve operations. As always, reach out to your dedicated customer success manager if you have any questions or [email protected].
We’re here to announce more improvements!
Welcome to the second SONAR release of the year! We’ve had some exciting developments in the works and are happy to introduce a couple of new updates to make your user experience even more valuable. No other freight company spends more time and energy investing in fine-tuning and improving data.
Flatbed rates are now available in Market Dashboard+
Your team now has the ability to manage bulk pricing of flatbed directly in the SONAR user interface. While customers have been sharing great feedback so far about the ability to price flatbed freight using TRAC API data, you can now price more lanes even faster by having the data accessible within the SONAR UI.
Custom Page Widget Selector
We’ve made it simpler than ever to build a custom page for your team! Widgets are available to select from a new landing page, with images and descriptions included to help make it easy to select the right one. This is especially helpful for new users or those who may be less familiar with SONAR. The tool also makes it easier to select your preferred visualization of the data for quicker analysis.
In addition to these updates we have also made several updates and improvements to the Chart widget that we hope will improve your user experience and make data visualization more intuitive and efficient.
More on the horizon
The product roadmap is full of excellent improvements, features and more that will add value and improve operations. Keep in touch with us to find out more at [email protected]
We’re here to announce more improvements!
No other freight company spends more time and energy investing in fine-tuning and improving data, nor can any organization compare to the volume, timeliness and fidelity of SONAR data. That is why the world’s leading brands have chosen SONAR as their source of truth for managing supply chain operations.
Updated Lane Score Now Available
The SONAR team is excited to announce an iteration to its Lane Scores feature in an effort to create the most reliable data source for the supply chain world. After thorough analysis, we’ve found that the updated lane scores better fit the use case of bidding an RFP. We’ve now made this available via the “SONAR Lane Scores” API endpoint to give your team greater confidence in their pricing decision making.
This data will come through as standard scores:
Updates to Lane Scores come along with several operational enhancements to SONAR’s benchmarking and analysis tools, SCI (Supply Chain Intelligence) and Market Dashboard+. Market Dashboard+ users will also notice easier upload file management with city and state datasets.
More Tender Data Providers Coming Soon
Late last year, we experienced a data issue with tender volumes due to a change with an inbound source. Because of this, we sought to create redundancy and leverage more providers to optimize our tender data. Data science worked diligently to create an environment where we have greatly reduced the risk of any problems in the future. Any one provider’s activity will not skew our indices so that we can trust the tender volume and rejection data even more than we previously did. Expect to hear more in the coming weeks.
Get ready for more big news soon!
But wait, there’s more! The product roadmap is full of excellent improvements, features and more that will add value and improve operations. Keep in touch with us to find out more at [email protected].
Welcome to the new year! While the world around us slowed down to enjoy the holidays, the FreightWaves SONAR team was hard at work building a foundation for the biggest year yet in product delivery. We’re excited to share updates across the product and our data.
Announcing Two New Indices
One of the most recognized and trusted tickers we have is the NTI (National Truckload Index). That data is only based on the dry van average. We have now launched similar indices for both Reefer (RTI) and Flatbed (FTI). Similar to the NTI, these can be viewed at the national level.
Quick Rates
We know your team has a lot going on, and sometimes they just need a quick rate. We’ve launched a simple Quick Rate tool that pops up in a separate window to be your pricing assistant, no matter what else is going on in the day. Simply drop in the mode, origin and destination and we’ll supply the Current, Low, and High TRAC rate in flat or rate per mile form.
Flatbed Rates in Market Dashboard
We announced at F3 that we had launched Flatbed rates, but those had only been available for API customers. We’re now bringing that data into the SONAR user interface! Flatbed rates come from the TRAC consortium, but unlike Van and Reefer rates, they are delivered using KMA methodology. Rather than focusing on zip to zip data and expanding in space and time to reach confidence thresholds, Key Market Area pricing automatically expands to one of our 135 areas across the US and considers all rates within those strategic geographies. We’ve tested for rate accuracy and confidently stand behind this as a strong methodology.
Improved Searching
Have you ever struggled to find a ticker? Now that we’ve launched our new user interface, we’ve made searching faster and easier. Anywhere in SONAR where you search to find a ticker is more flexible (including charts, widgets, custom pages, and Market Dashboard). You can now type in keywords from ticker descriptions (ex. Volume, Reject, Chicago reject, etc.).This flexibility also gives us the ability to make improvements to categories and sub-categories in the near future.
Receiving API Capabilities
SONAR customers have partnered with us to create TRAC, which is the most up-to-date spot pricing available on the market. In order to simplify TRAC contribution, we’ve built an API endpoint to streamline the process of sharing data. This also opens the door for great new opportunities to expand into different modes and geographies (Mexico, Dray, Ocean anyone?). While much of the data behind the platform you trust comes from unbiased third parties, we believe in partnering with everyone to create a more transparent future. Interested in partnering with us? Let your Customer Success contact know.
FreightWaves SONAR product, development and data science teams have focused on customer feedback and prioritized work based on specific requests from SCUBA (SONAR Customer User Board of Advisors) customers. We are pleased to announce several exciting new features releasing this week!
The New SONAR is Coming Soon
Coming very soon, all customers will have access to a faster, stronger, and streamlined SONAR. We will have more announcements in the weeks to come, along with a webinar and more demo videos to make sure everyone is ready. Key updates include a dynamic new market dashboard, easier movement between applications, and several enhancements to the way charts are searched, gathered, displayed, and saved. Throughout the system, users will notice less load time, fewer clicks for functions, and so much more. We can’t wait to let you try it out!
Announcing Flatbed Spot Rates
It’s a whole new mode! We have been collecting flatbed data for quite some time and have achieved enough volume and velocity of the data to represent the flatbed market to a level that meets our standards. The SONAR data science team seeks to uphold strict data protocols to give customers the highest level of confidence as they benchmark their current and potential freight. Flatbed rates are only available via API at the KMA (Key Market Area) level at this time.
New Benefits for TRAC Contributors
To thank our contributors and to add additional value for new partners, SONAR is now offering TRAC Benchmarking, a tool that specifically gives these companies a unique way to see how their business stacks up, whether day-to-day or on a much larger scale. Only TRAC contributors will have access to this benchmarking tool.
TRAC Rates in SCI
Users of Supply Chain Intelligence can now benchmark against both contract and spot rates as they analyze their entire supply chains. Spot rates will replace peer rates in the user interface, but peer rates will still be available in the data downloads for those who seek to compare to that market data.
But Wait, There’s More
SONAR also has a new methodology in place to allow customers to analyze pricing by Key Market Area to Key Market Area (KMA to KMA). KMA to KMA rates allow for better trend analysis since they minimize volatility by incorporating more data into each rate. This provides users a new way to view rates using legacy systems they may already have in place and paves the way for new, highly impactful customization that will give users additional speed and flexibility.
Thank you for continual feedback and partnership as we continue to strengthen how we help manage the supply chain. If you have any questions or feedback, please contact customer success at [email protected].
We’re excited to announce the release of flat rates in SONAR. Flat rates deliver the full rate including fuel, rather than giving a rate per mile. This new enhancement will enable users to quickly understand market pricing without having to consider miles. Users will simply click a toggle in Market Dashboard and Market Dashboard+ to switch between Rate Per Mile and Flat rates to meet their preferences. In addition to this, customers will be able to view a 90 day average for contract rates in Market Dashboard+, giving users additional flexibility around current and historical market pricing.


The FreightWaves team is constantly looking to strengthen the rate data we deliver and how it is used. In the coming months, you will see continued innovation around this data. We look forward to sharing what’s next very soon. If you would like to learn more, please contact Customer Success at [email protected].
Container Atlas provides users with real-time access to critical ocean freight data and market analytics. Container Atlas carries accurate signals to strengthen your decision making. With our port-to-port pricing, your team can accurately enter strategic or transactional situations with confidence.
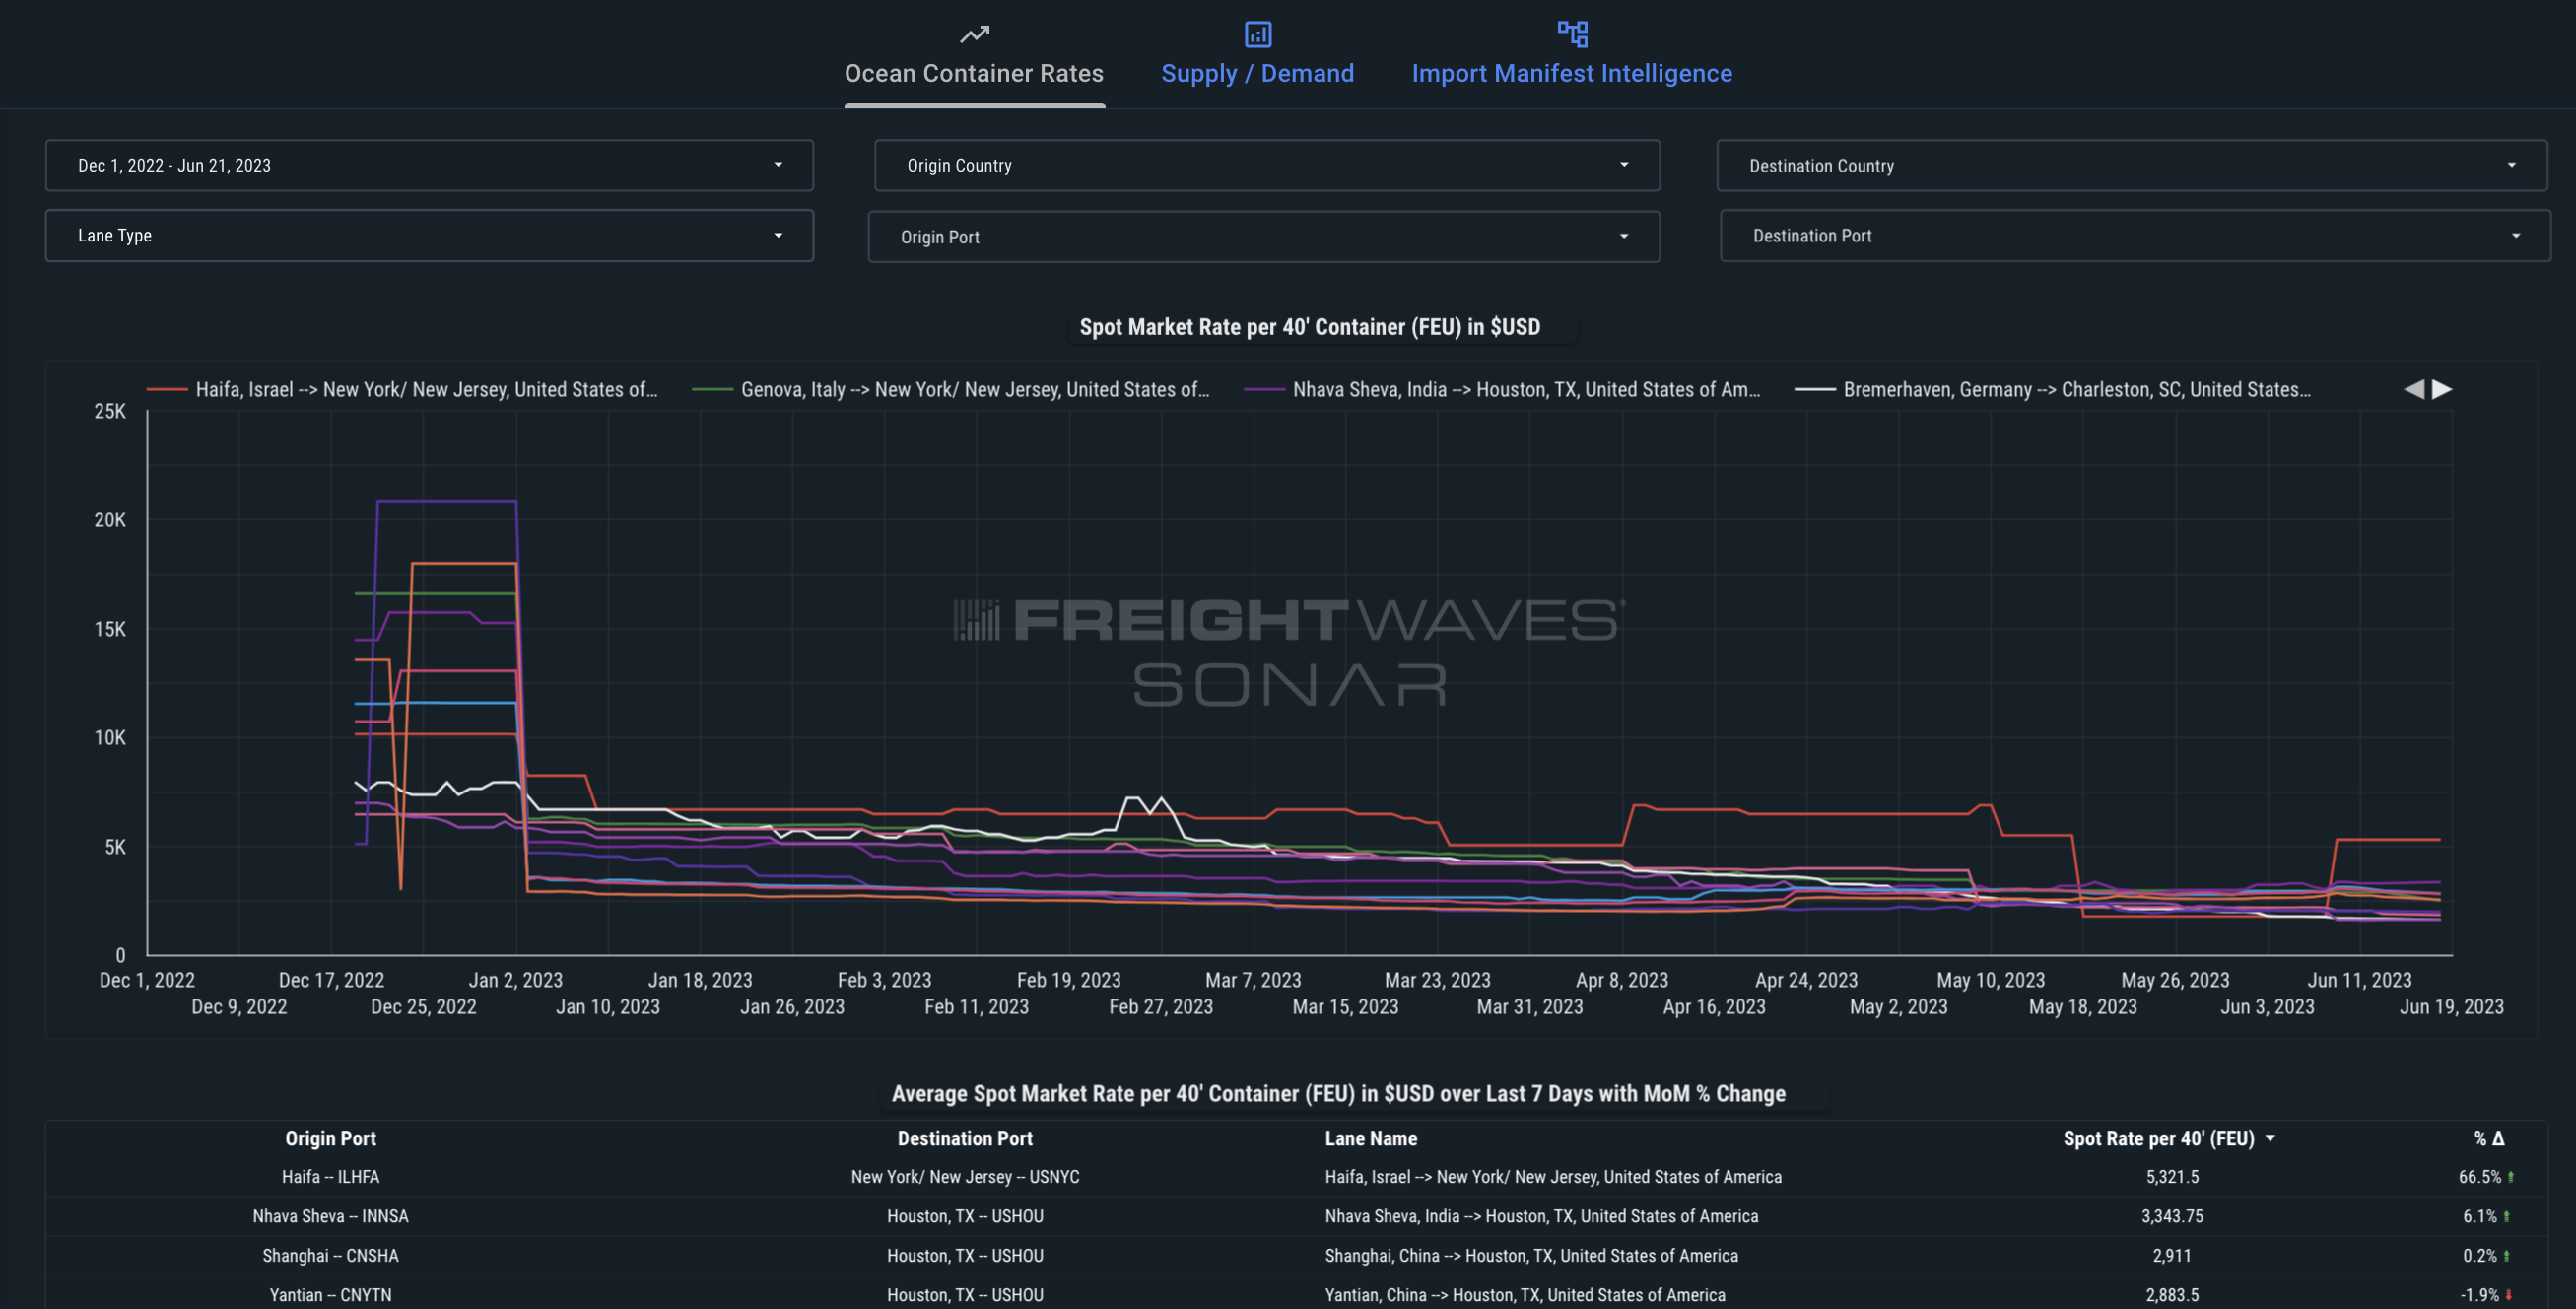
Container Atlas currently has volume and pricing on the top 36 port-to-port lanes. The daily rate data, from Freightos, an industry leader in strategic and transactional container movement.Users can shift from port-to-port to regional pricing as they monitor and action on lanes to create a tactical impact while still leveraging the tool to build a strategic global supply chain. Container Atlas empowers you to navigate complex market dynamics with ease.
Please feel free to reach out to your Customer Success representative if you have any questions or email [email protected].
The FreightWaves SONAR team is excited to announce major new updates in this week’s release.
Contract Rates are Now Available
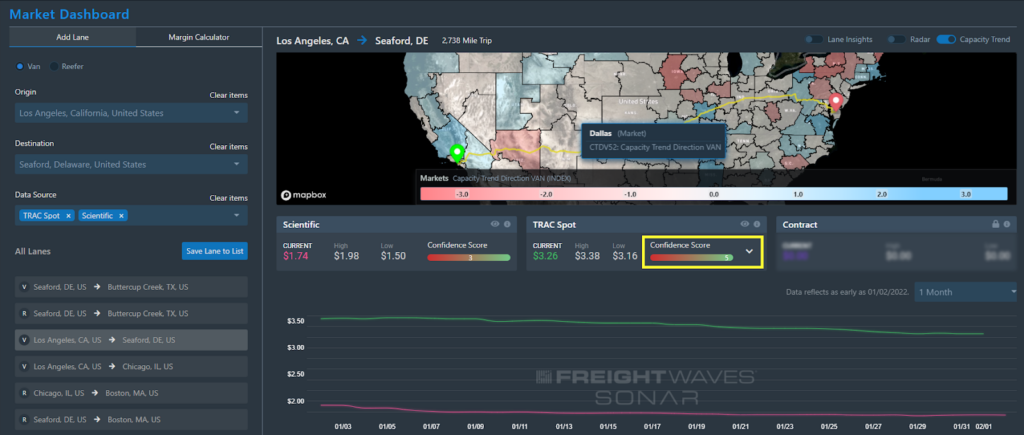
First, the release of Contract rates into Market Dashboard, Market Dashboard+ and API. Contract rates are the rates paid to the carrier by the shipper and provide additional clarity into the overall freight spend on individual lanes. Users will be able to visualize and compare the Contract rate with the TRAC spot rate in a given lane, and understand the volume of Contract loads being referenced. Contract rates are all-in rate per mile including fuel, similar to how TRAC data is displayed today.
Contract rates will display in Market Dashboard very similarly to TRAC rates, as seen below:
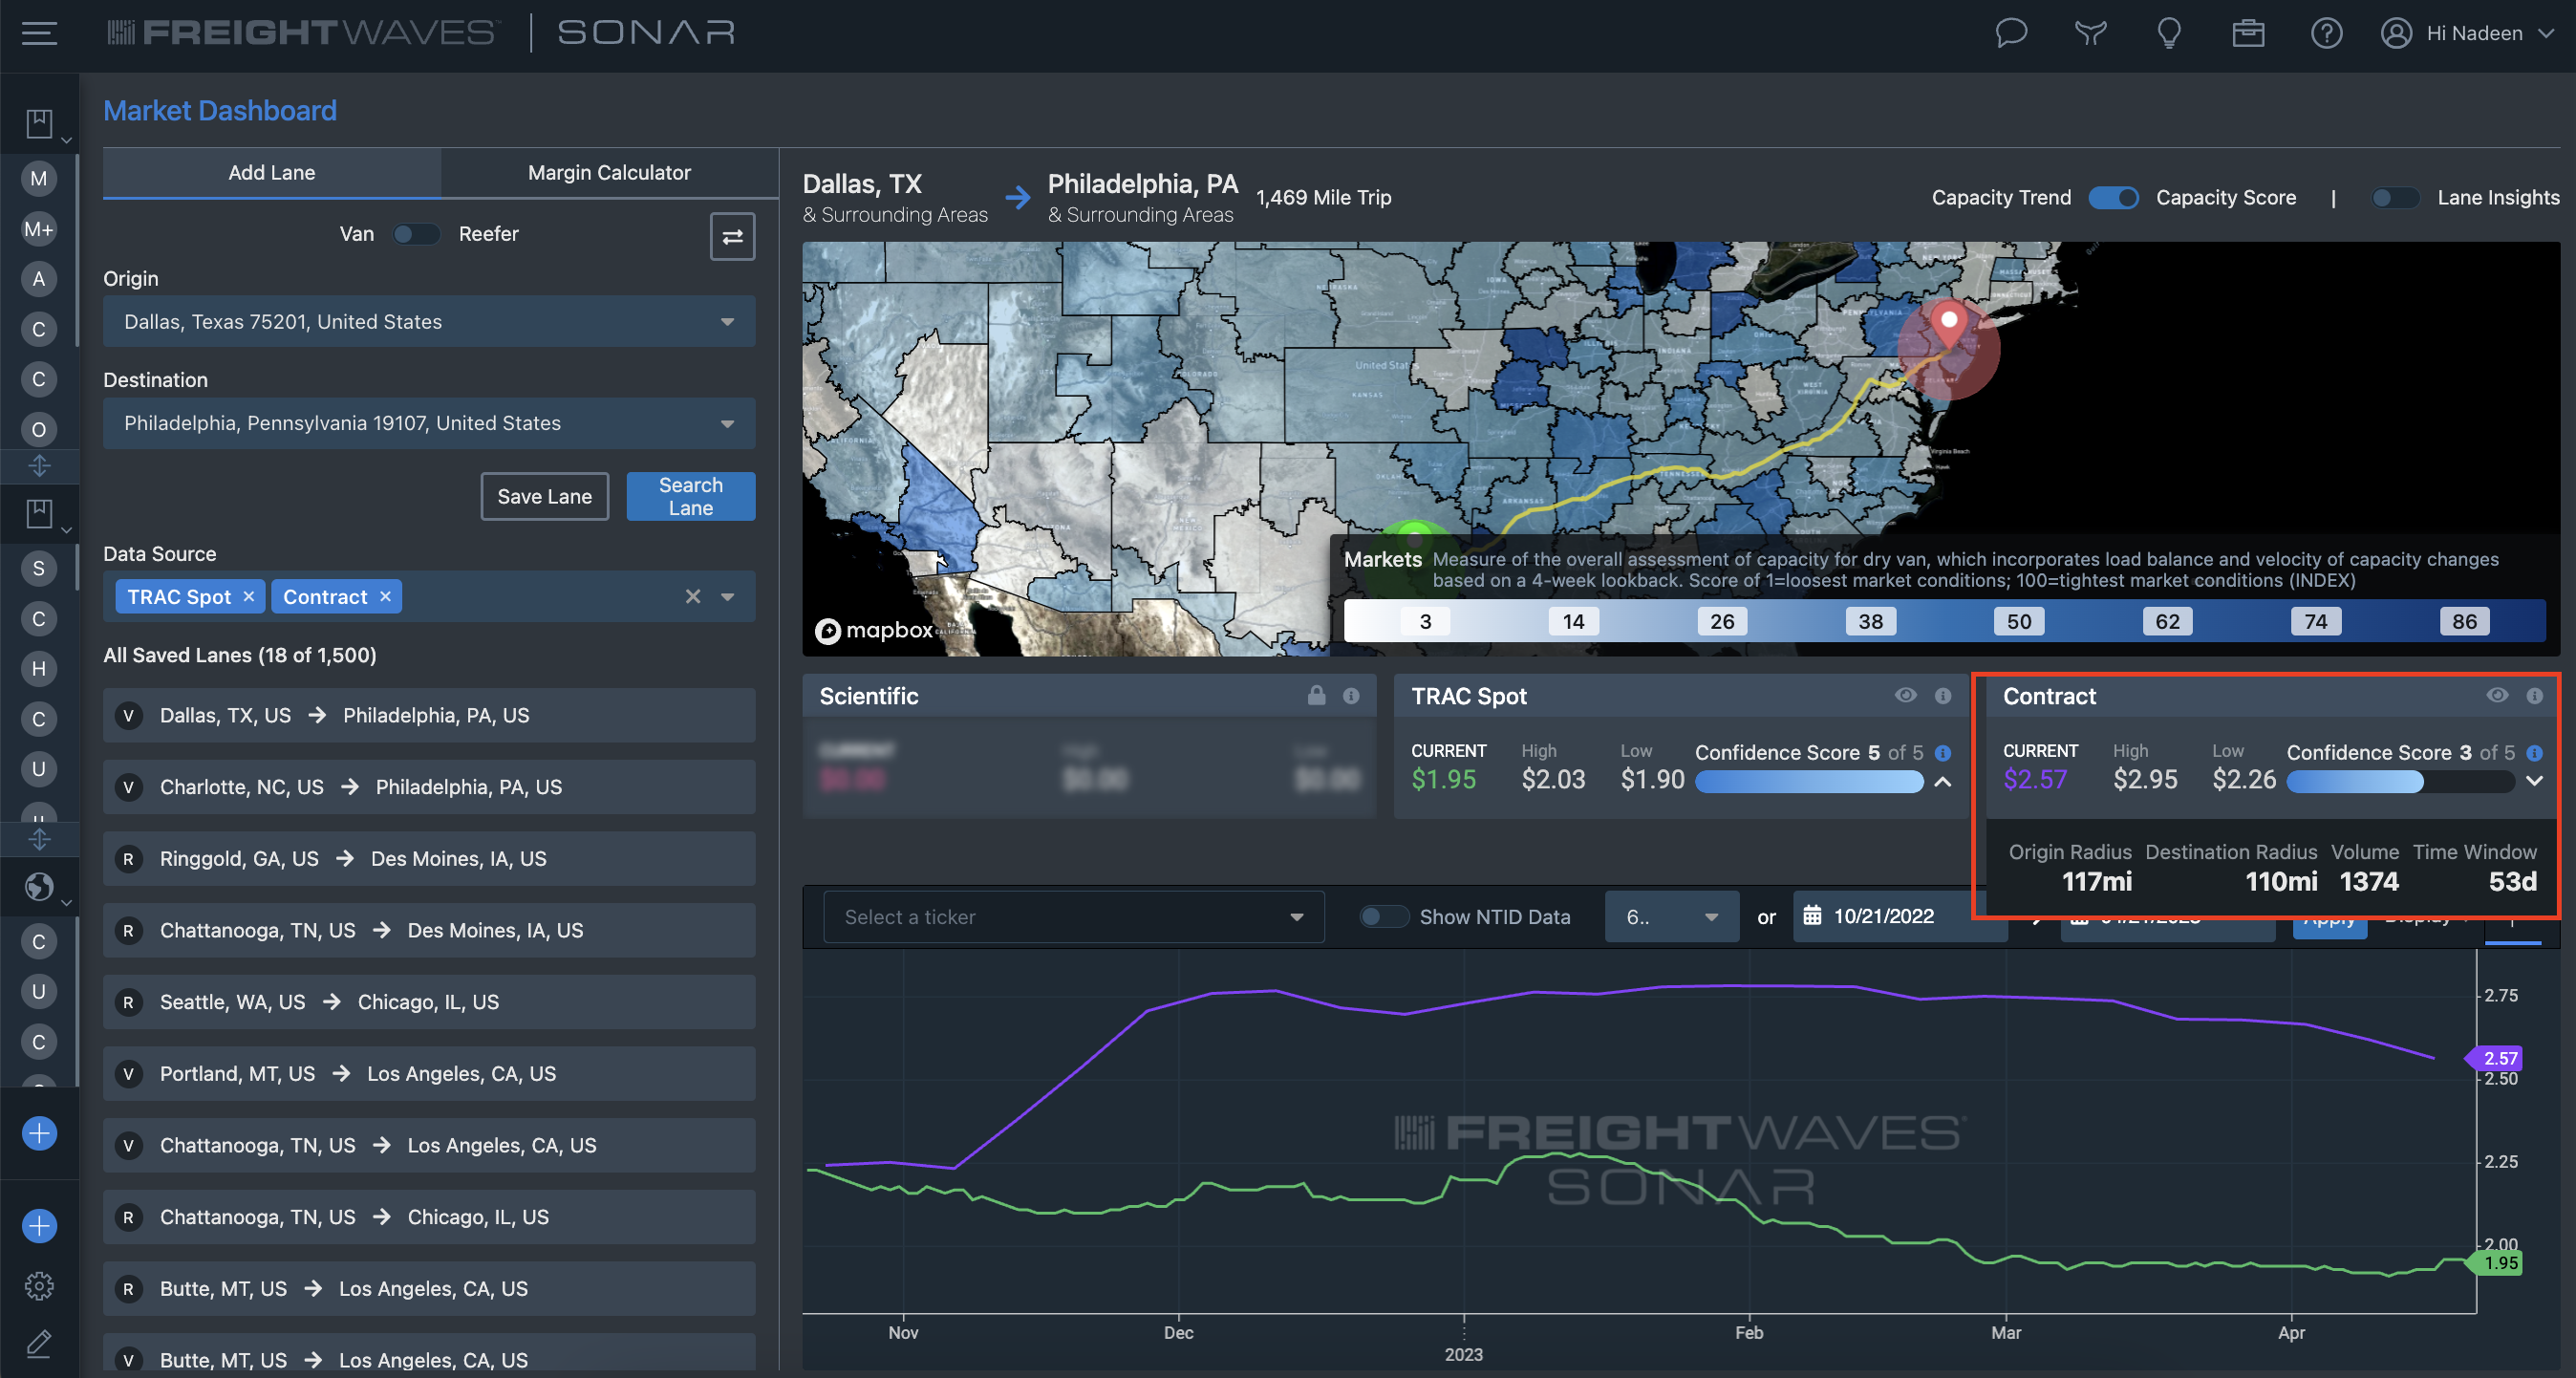
The Contract rate data has the same meta data available as our TRAC rates. You can see the radius or origin and destination, volume, and the time frame considered. Loads that are more recent and closer to the origin and destination are weighted more heavily. This helps drive consistency and accuracy in the average rates. Below is how the Contract Rates might look in Market Dashboard+:
FreightWaves SONAR seeks to provide transparency and simplify decision making across transportation teams. Contract rates are designed to offer the most clarity into buying behaviors at the shipper level in the supply chain industry. As SONAR users explore more data sources and apply them to their own unique businesses, they will be able to create better strategies around budgeting, bidding, and operating freight flows.
Market Dashboard+ Enhancements
Market Dashboard+ now has exciting new data, giving users the ability to make stronger decisions. TRAC rates now have an available filter to show Day over Day trends (DoD), which helps users understand directional movement in lanes or markets. Users can also quickly understand tender rejection data (OTRI) at the mode specific Van/Reefer level on those lanes. OTRI is at the market level, to demonstrate origin supply and demand based on carrier behaviors. A lower OTRI score indicates higher demand for freight and signals less available freight moving down a routing guide or into the spot market.
New TRAC Contributors
A new round of contributors have been added to the Trusted Rate Assessment Consortium, which increases the scope and accuracy of the most up-to-date spot rate data in the industry. TRAC covers more than 1 million unique van or reefer lanes and is updated daily with actual booking data from roughly 25 of the largest brokers and 3PLs. As TRAC grows and becomes more refined, transportation teams continue to increase pricing accuracy and reduce time spent on decision making or validation.
Please feel free to reach out to your Customer Success representative if you have any questions or email .
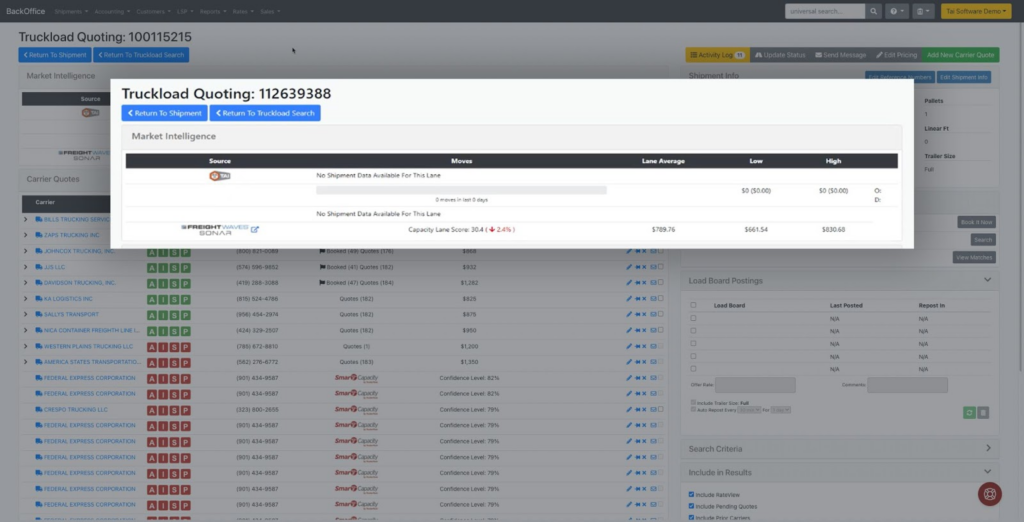
The FreightWaves SONAR team is excited to announce the release of Dynamic Capacity, a new strategic carrier sourcing tool that lives inside SCI. Dynamic Capacity provides users with the ability to see carriers that have run the lane before.This gives users the ability to reach out to known carriers on lanes they are struggling to find capacity for, increase carriers coverage on their RFP lanes, and be able to see the density of carriers that run in a specific lane.
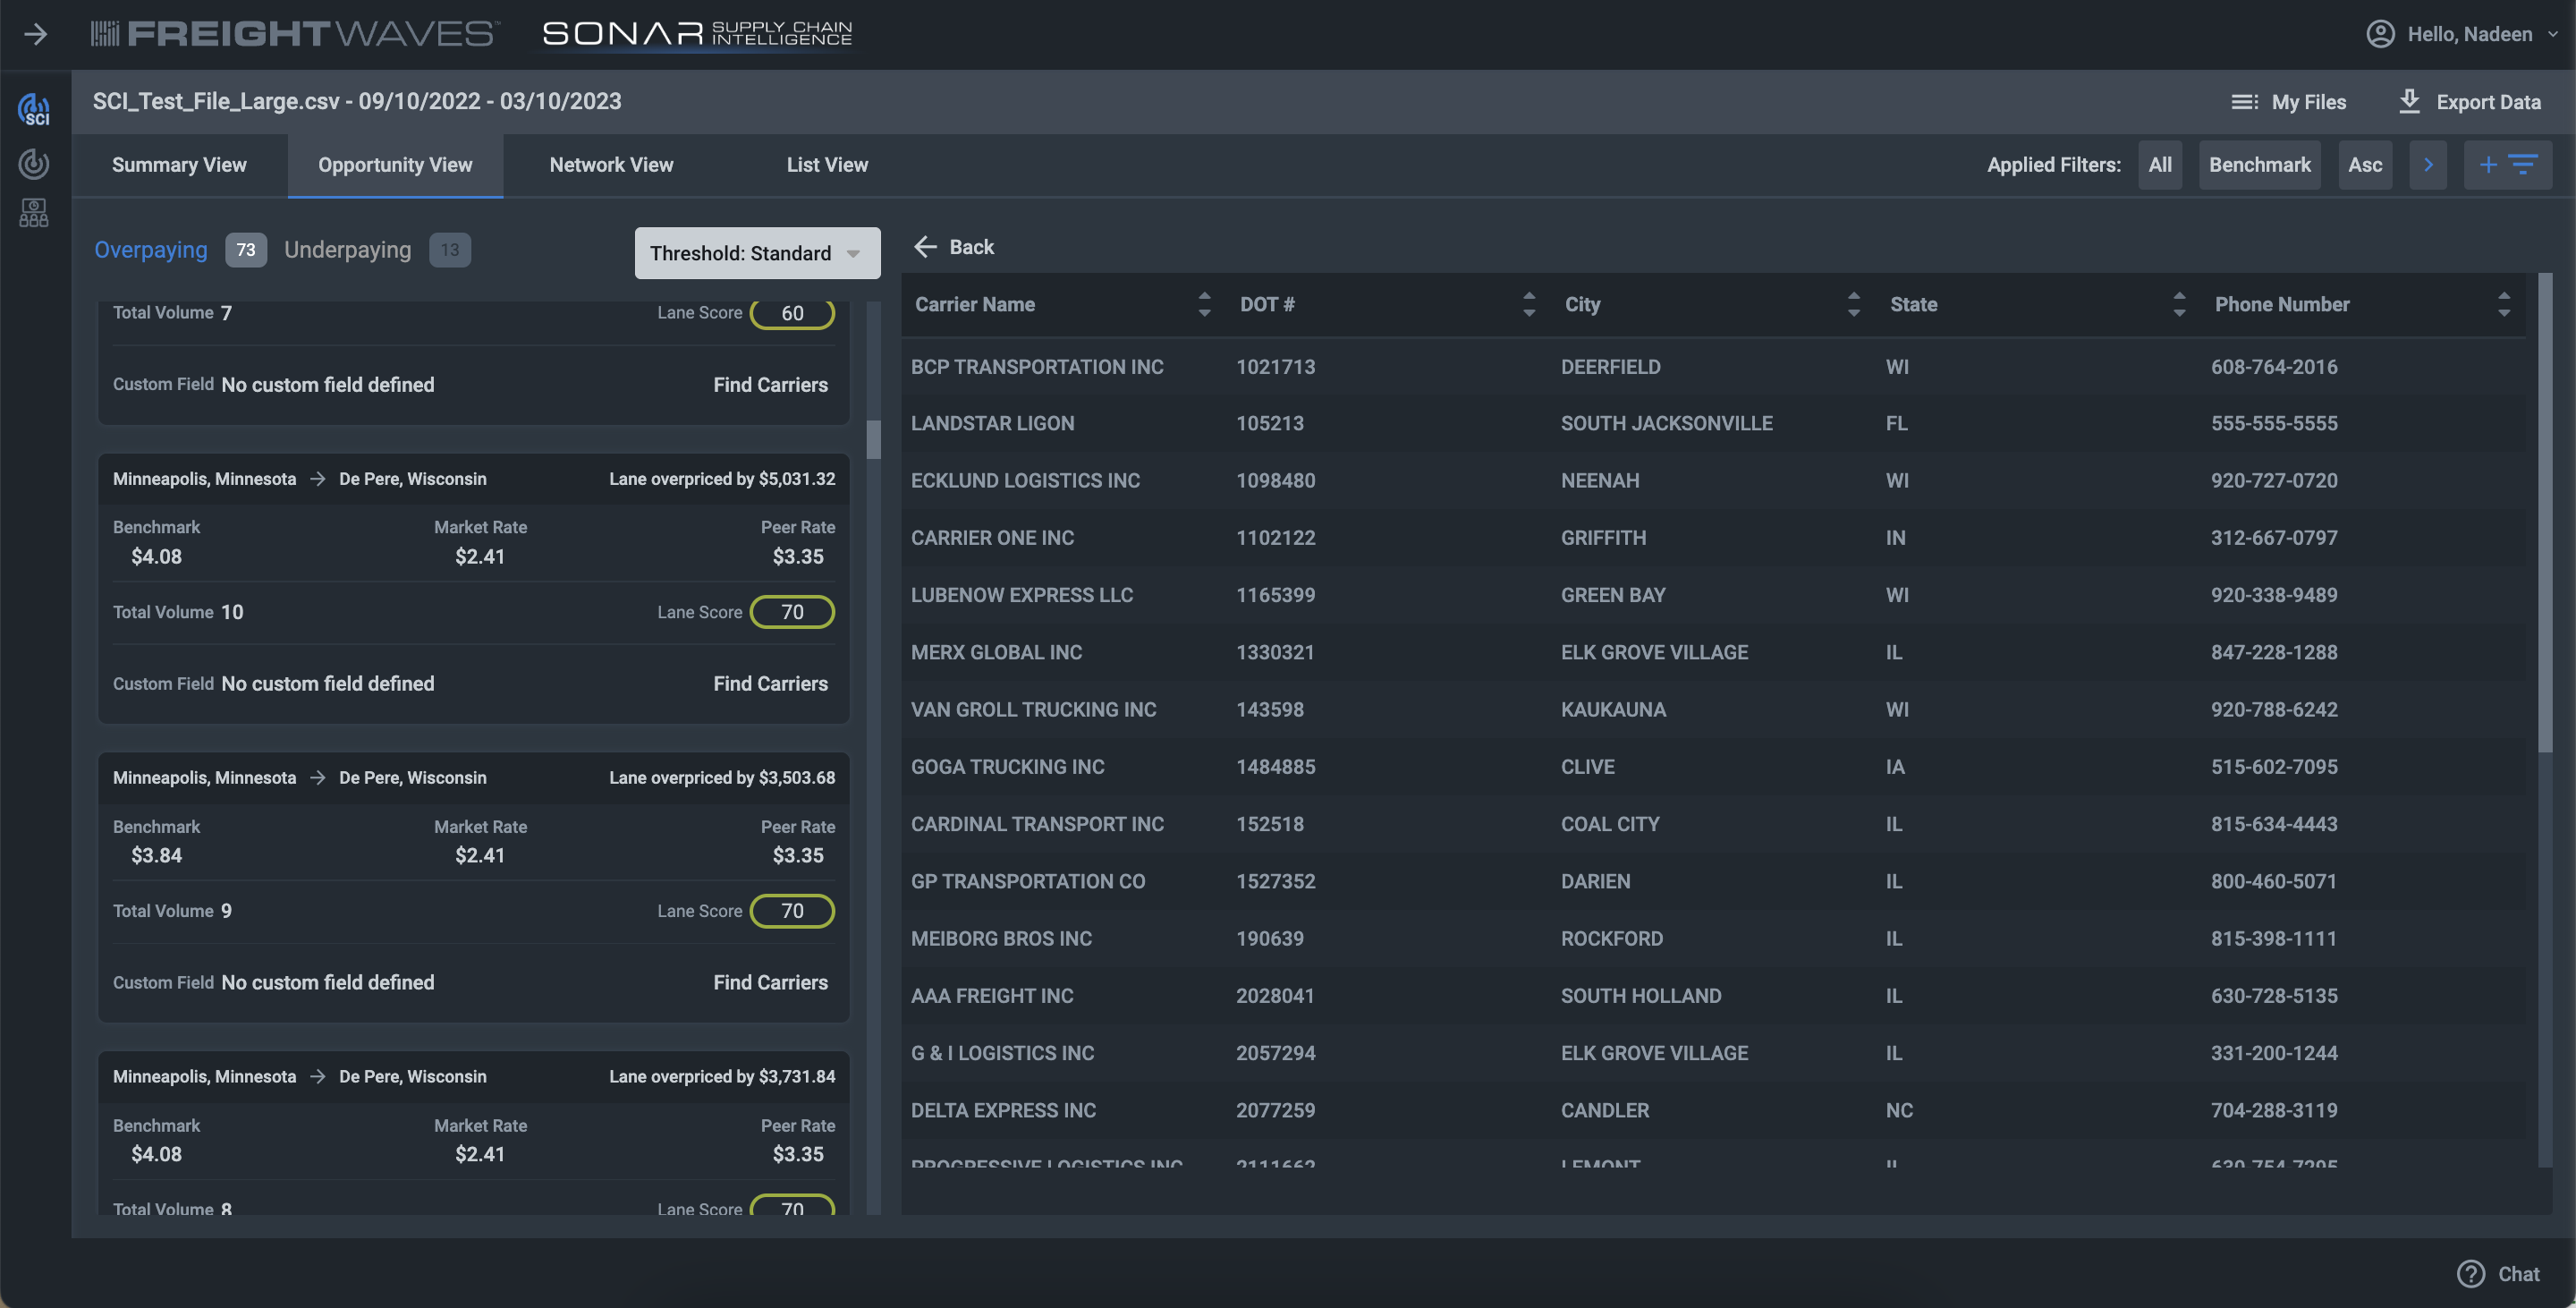
To access Dynamic Capacity, users click the “Find Carriers” button on a lane in the Opportunity View, as seen below:
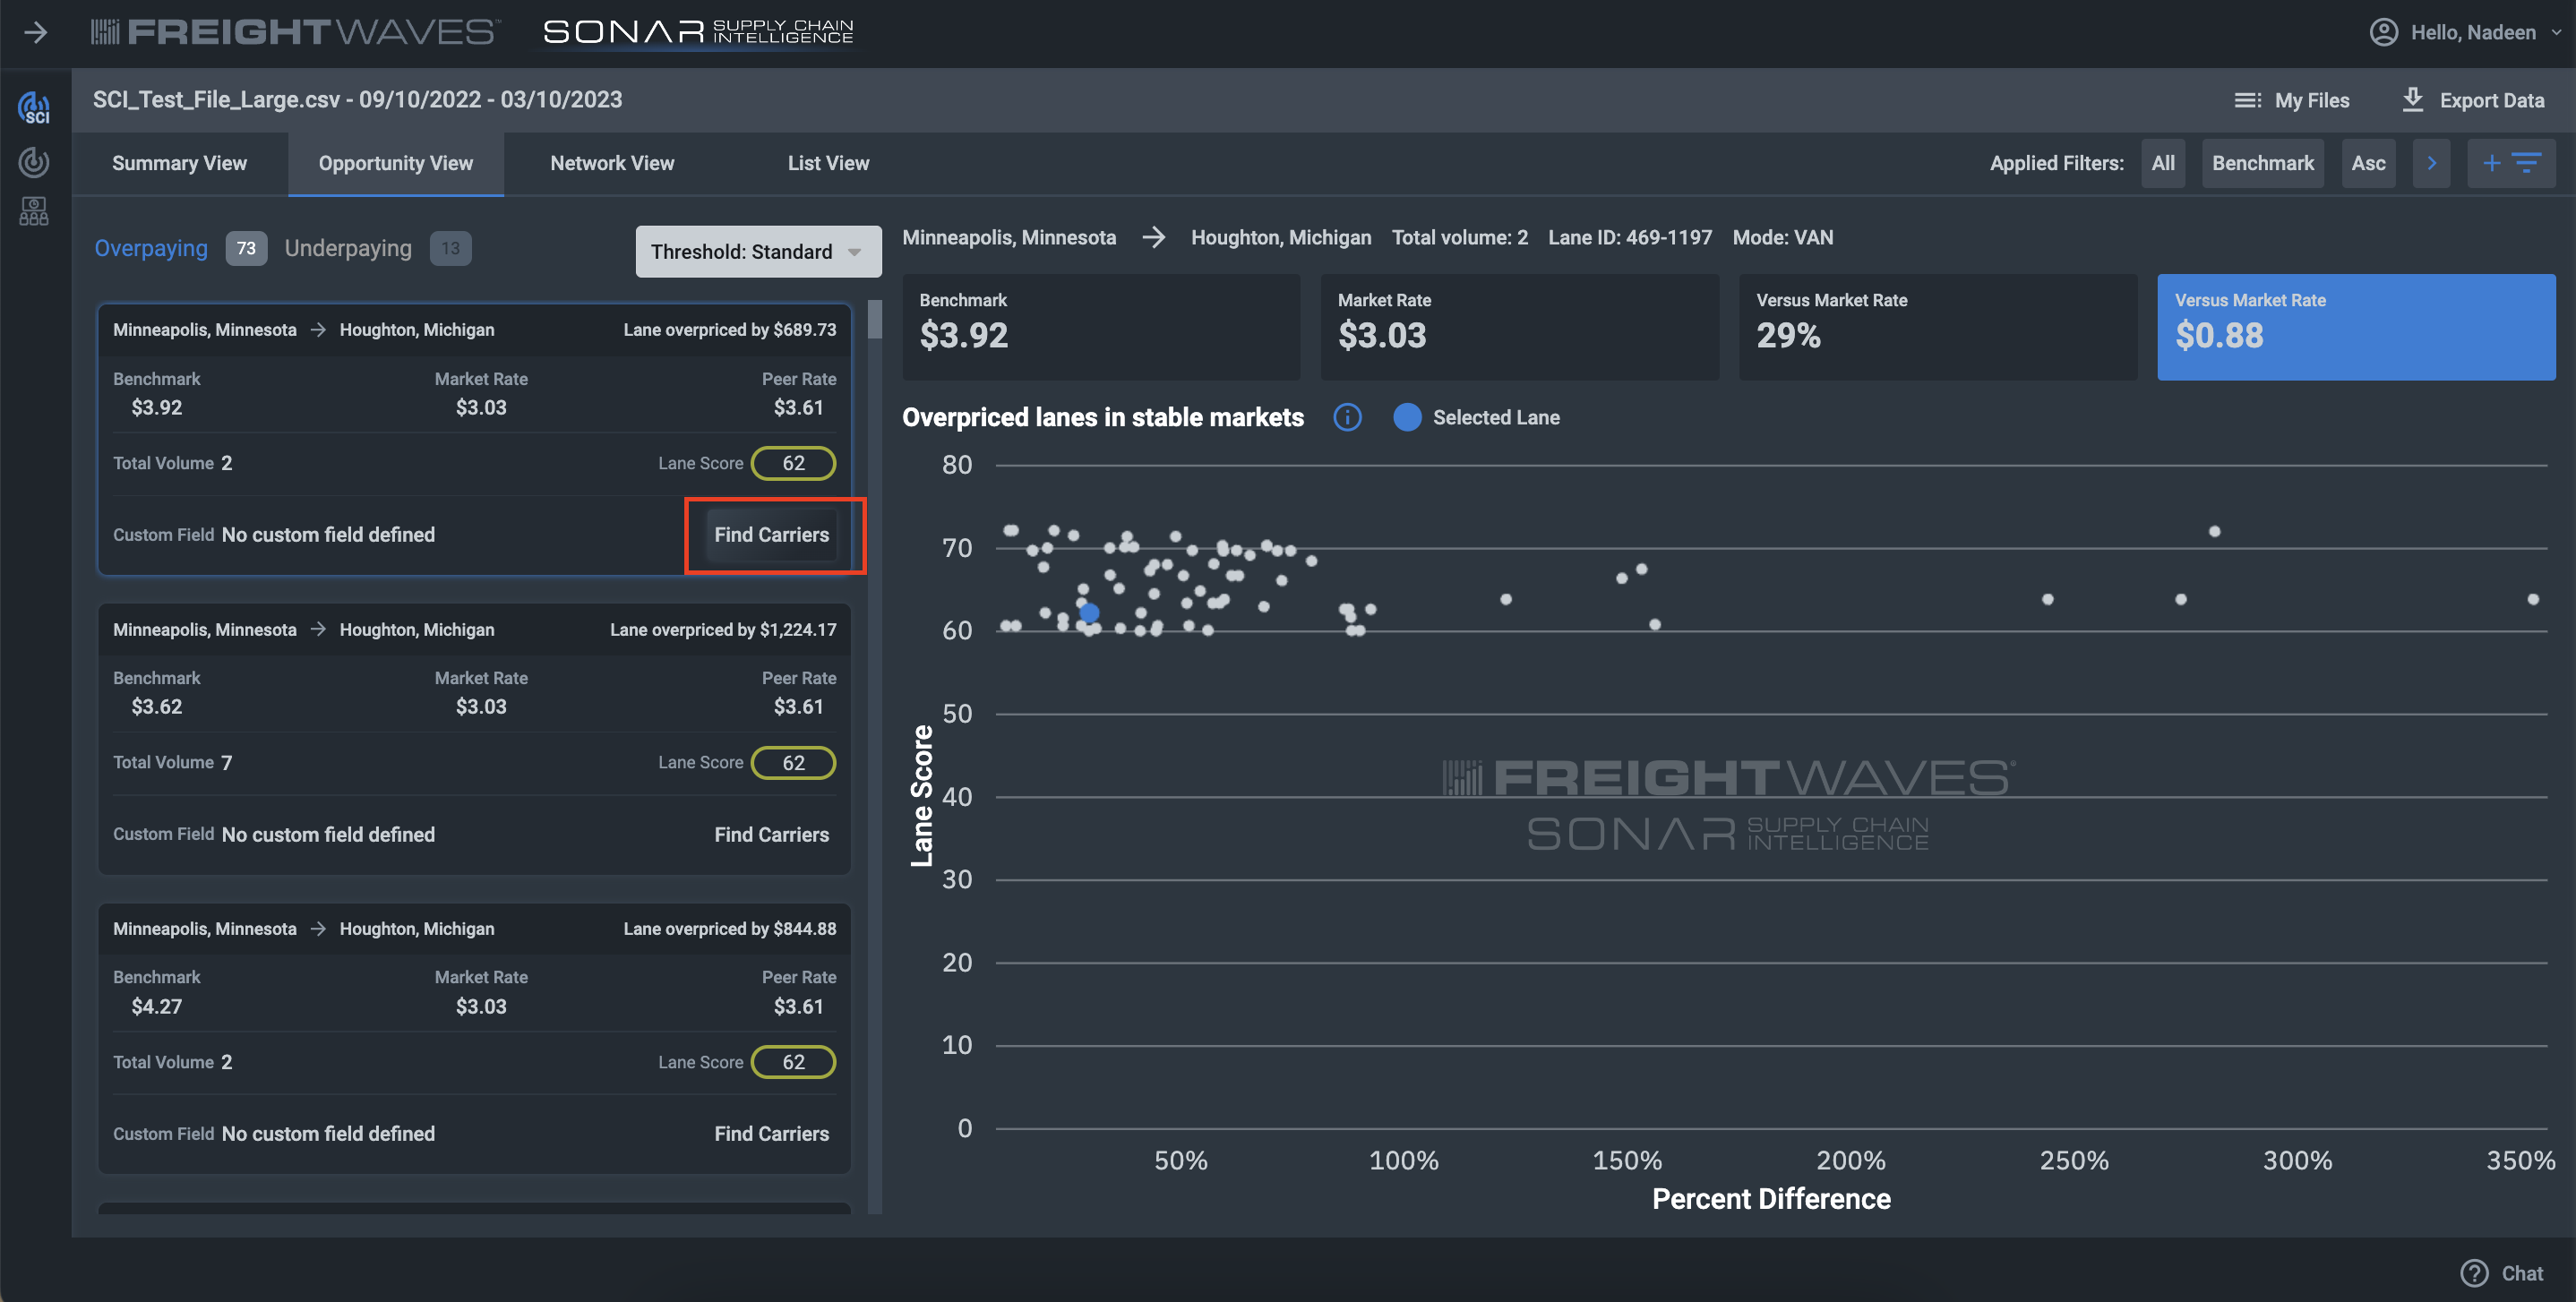
After a brief analysis, a list of carriers will be provided, showing carriers that have hauled freight in the same market-to-market corridor in the last year.
FreightWaves SONAR seeks to provide transparency and simplify decision making across transportation teams. Dynamic Capacity is designed to offer alternatives when carrier performance falls beneath expected thresholds, on new or potential lanes, or to validate decision making when considering contract negotiations.
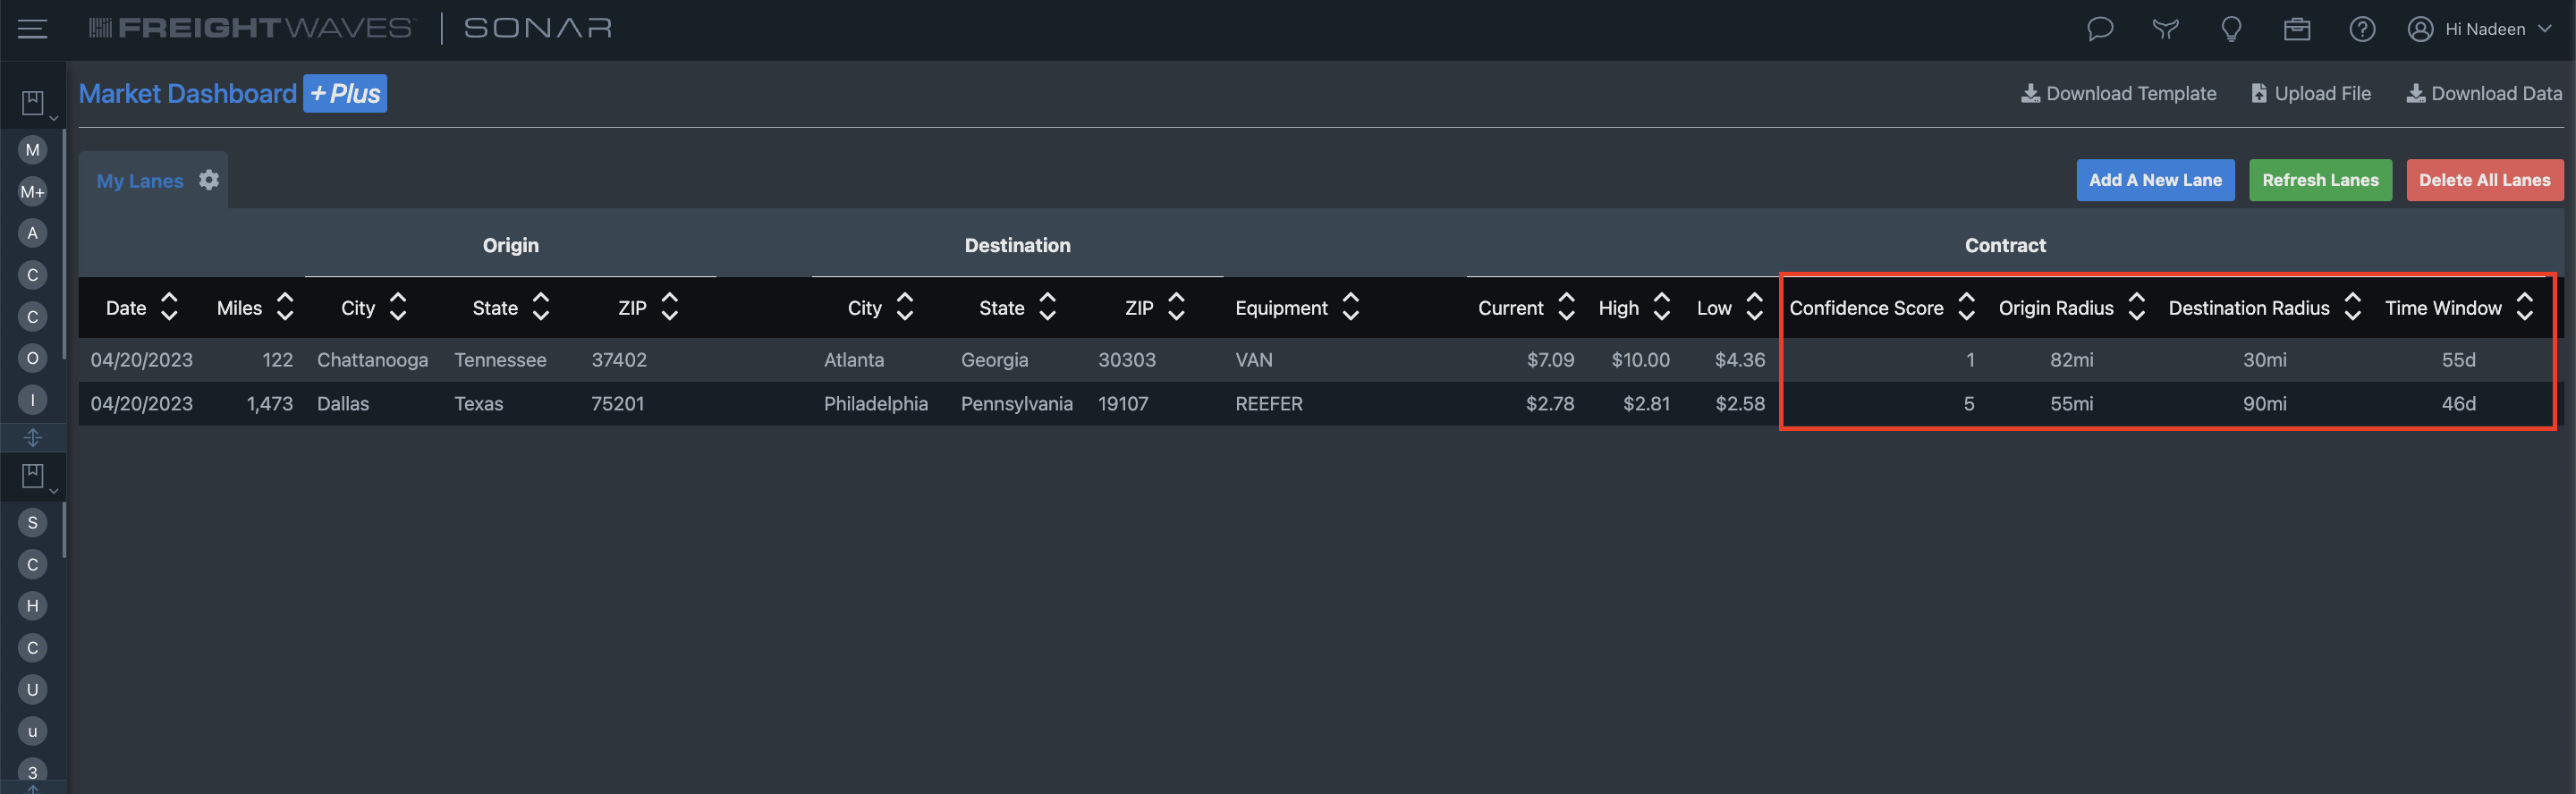
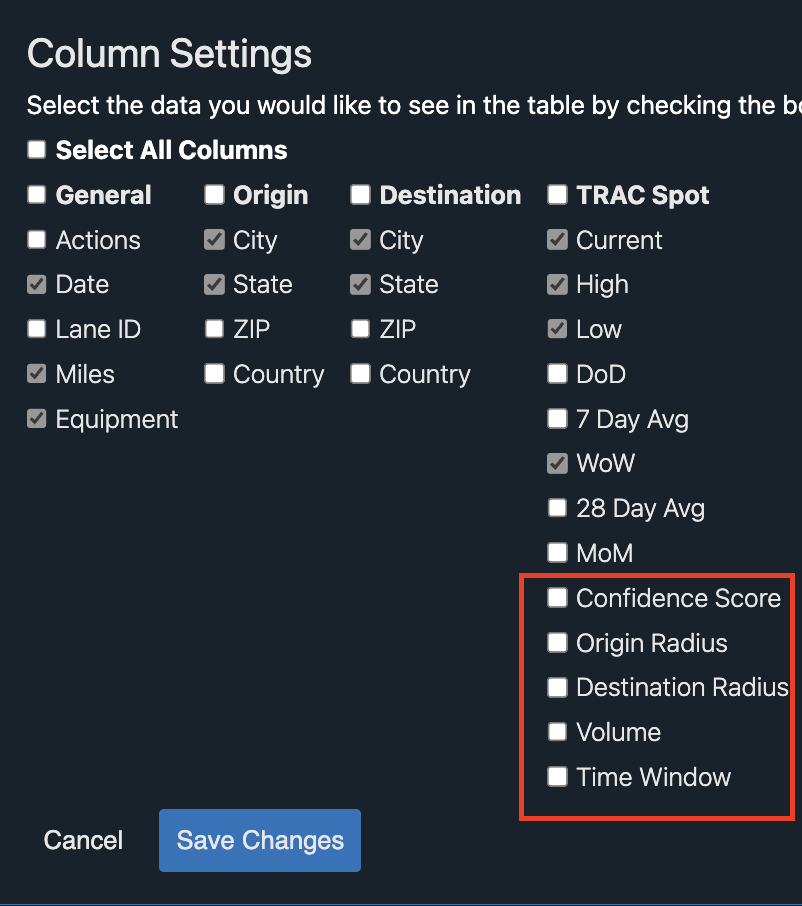
Market Dashboard+ Enhancements
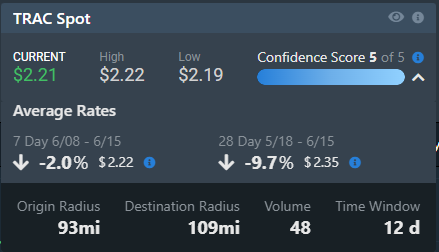
Market Dashboard+ now has additional data and filters to improve usability and drive accuracy in pricing. New data around TRAC: confidence Scores, origin radius, destination radius, volume, and time window all strengthen decision making and simplify processes for users so that they can operate effectively out of one dashboard. These will default off in filters for now.
Please feel free to reach out to your Customer Success representative if you have any questions or email [email protected].
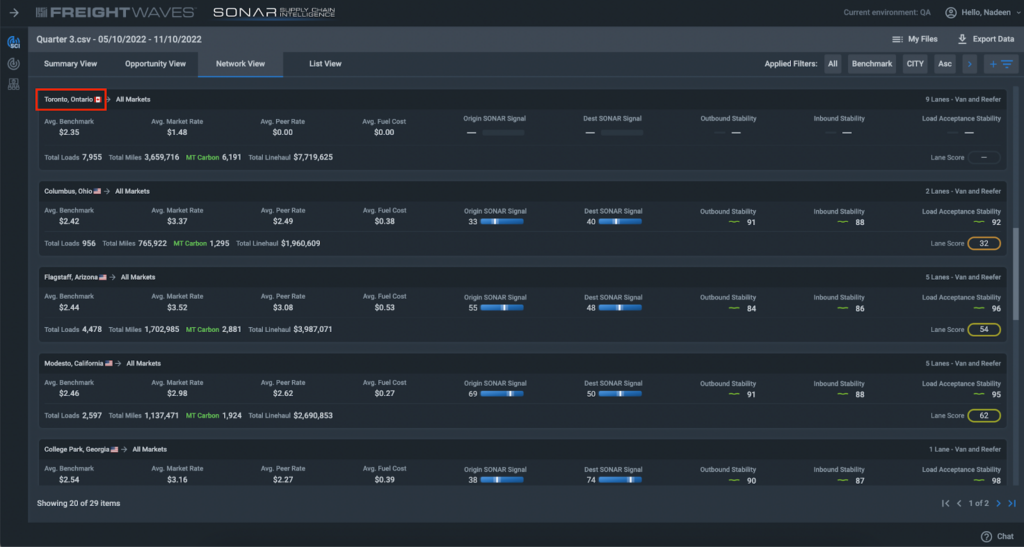
Canadian data now available in SONAR SCI
FreightWaves is excited to announce that users can now see Canadian data within the SCI platform.
Currently users will have the ability to upload a file that includes Canadian lanes, this can be either cross border or intra-Canada. Users will see the market rate available for their lanes they have uploaded. For now, we will not be showing any other data surrounding that lane but our Data Science team is working on creating more insights for Canada.

Please feel free to reach out to your Customer Success representative if you have any questions or email [email protected].
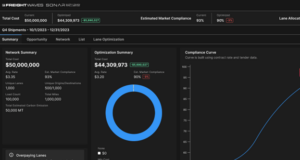
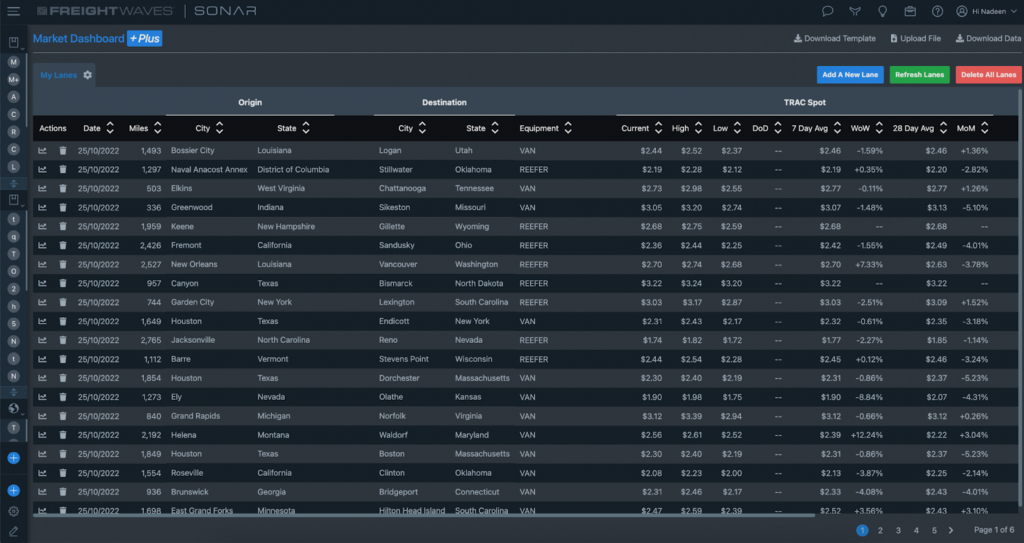
Market Dashboard Plus
We have kicked it up a notch!
If you are familiar with the Market Dashboard, you will be very familiar with Market Dashboard Plus. Market Dashboard Plus is an app within the SONAR platform where users can upload up to 10,000 lanes at once to get near-time insights.
Inside the Market Dashboard Plus, users have the ability to:
Currently, Market Dashboard Plus is an add-on feature to SONAR. If you are interested in learning more and gaining access, please reach out to your Customer Success representative or email [email protected]
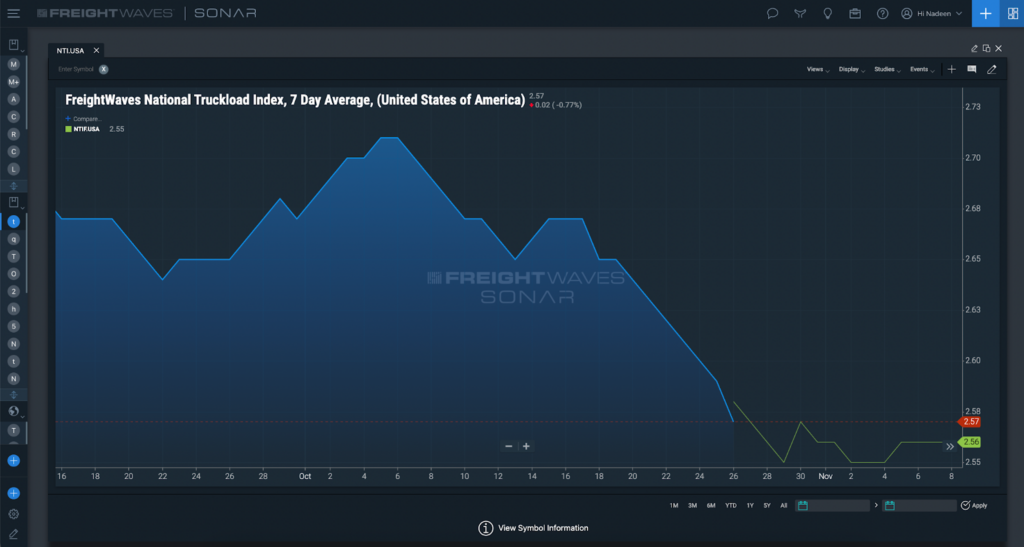
NTI Forecast
FreightWaves data scientists have developed four new National Truckload Indices that are forecasting the national rate per mile.
These tickers will be available in SONAR under the FreightWaves National Indices category.
If you have any questions about this release or would like access to Market Dashboard Plus, please reach out to your Customer Success representative or email [email protected].
Enhancements to FreightWaves SONAR SCI
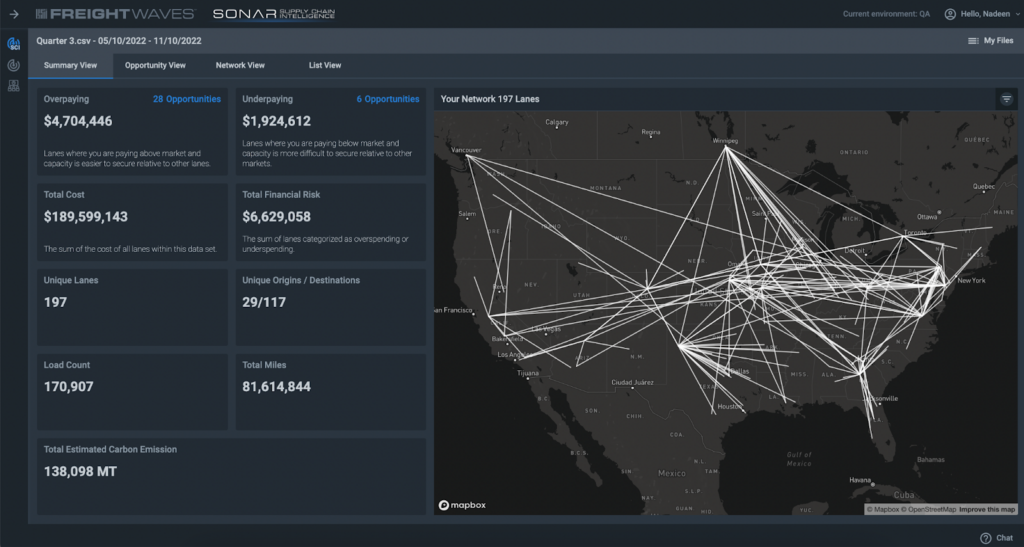
Summary View:
FreightWaves has completely enhanced the Summary view page to give users more insights into their file!
When landing on this page initially, you will see the same information as before – just in a different format. We have removed the Heat Map to give some additional enhancements to the map.
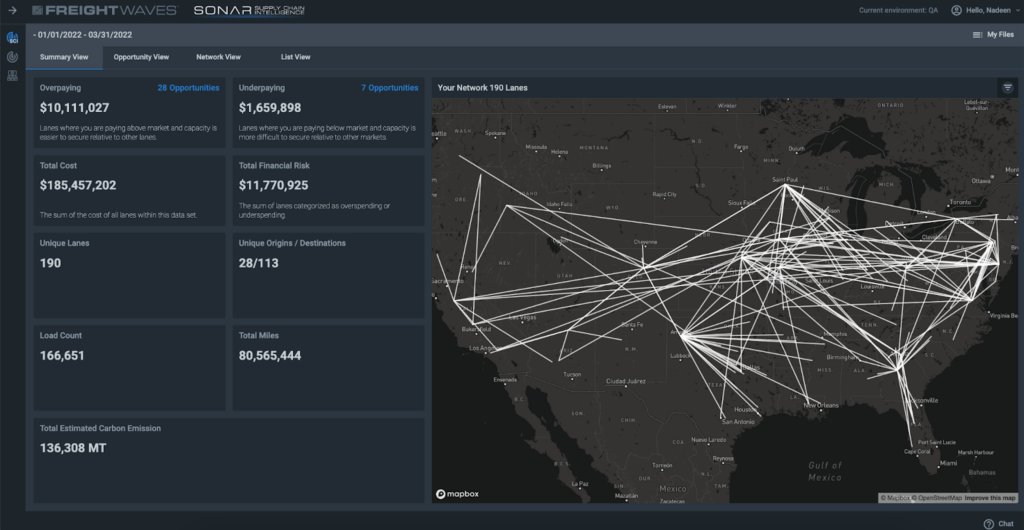
Users can click on the filter option on the right side of the map and open more filtering options. They have the option to filter by a specific lane by typing in the origin and destination zip3. They can also choose to look at a specific equipment type (van or reefer).
Other filter options users will have is to look at unique origins and unique destinations. This gives them a good visual into their specific file and the layout of the country.
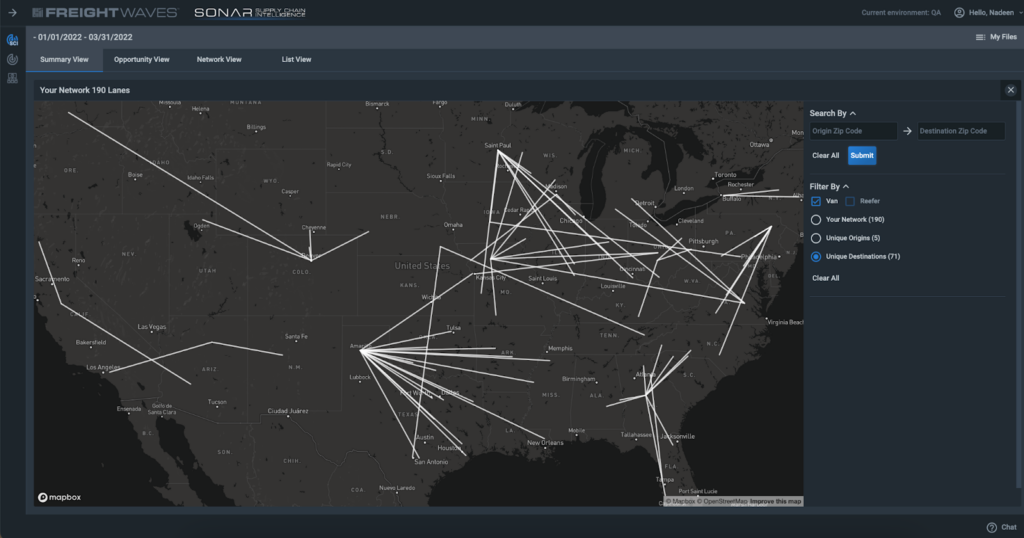
An additional feature they can use is to click on any lane on the map and a lane details card will populate and show more detailed information regarding that lane.
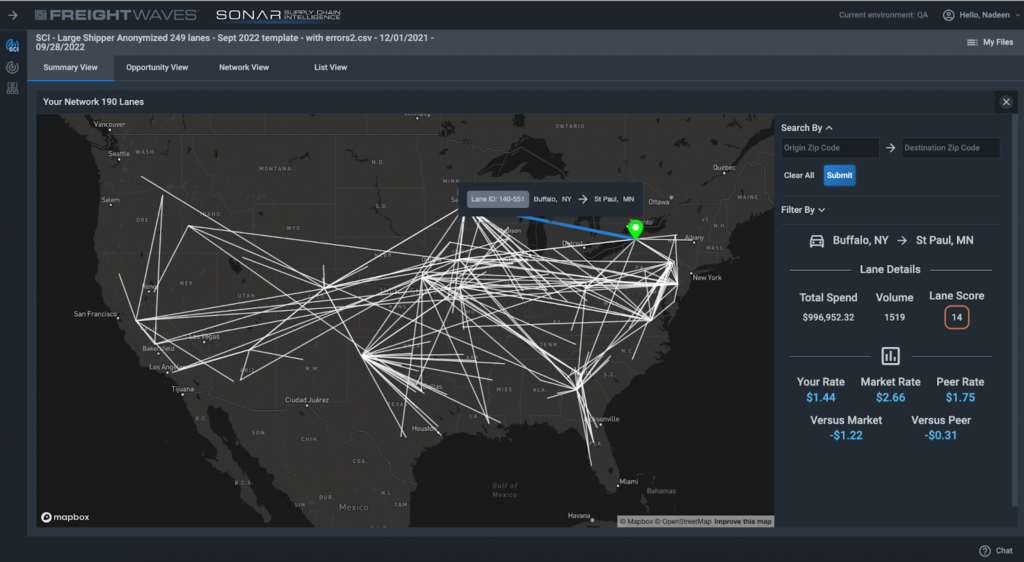
NOTE: if the file uploaded has more than 250 lanes, the map will only show their top 250 lanes by the highest volume.
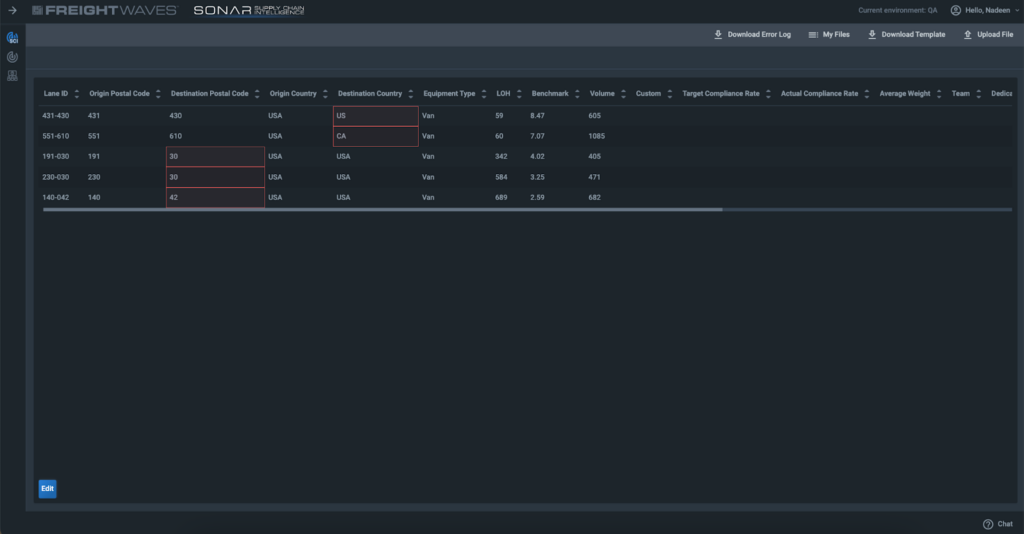
Inline Editing:
Users now have the ability to edit any errors that may have occurred during the upload process directly inside the SCI user interface.
When users upload a file that contains any errors, they will have the ability to edit those errors within the application. They will see red boxes highlighting where their errors are and have the option to either edit or delete them from their file. Once they choose, they can analyze their file.
Users will still have the ability to download their error file and reupload the file after they have fixed their errors.
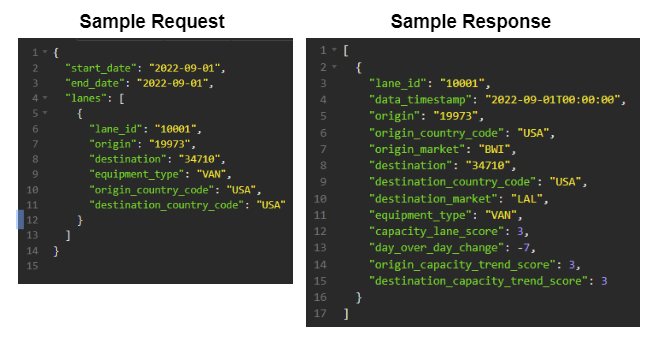
Capacity Lane Score via API
You can now access FreightWaves Capacity Lane Scores via a new API endpoint!
This score is calculated using any U.S. origin and destination market Capacity Trend Score combination. The market scores translate tender volume and rejection data into a relative measure of market capacity. The new endpoint returns the capacity lane score, the day-over-day change in the score and the equipment-specific 4-week score for the requested origin and destination markets. The lane scores and day-over-day change can help carriers, brokers, and shippers identify where they have leverage to negotiate and how that leverage is changing.
These data points can be called by specifying origin and destination zip codes and a start and end date for the range over which you want the scores. SONAR currently supports both van and reefer equipment types.
For more information on the Capacity Trend Scores click here. If you are interested in gaining access to this endpoint or need more information please contact your favorite customer success representative or email [email protected]
If you have any questions about this release, please reach out to your Customer Success Representative or email [email protected]
Multi-factor Authentication (MFA) Login Process now added to SONAR and SCI
More Market Dashboard Improvements
This improvement gives the users the ability to compare our proprietary indices with our TRAC and Scientific Rates – giving them more insights and better negotiating power.
If you have any questions about this release, please reach out to your Customer Success Representative or email [email protected]
Market Dashboard changes
FreightWaves has optimized the performance of the SONAR Market Dashboard, which will now load much quicker than previous versions. As part of that change, we’ve added a “Search Lane” button which will be needed to initiate a new search.
Additionally, the number of lanes that can be saved has been capped at 1,500. (Meanwhile, we are busy creating a new tool that will give you analyses similar to what you’d get in the Market Dashboard…but in batches!)
Bug Fixes
The U.S. rail volume data (all U.S. granularities of the ORAIL and IRAIL tickers) has been updated in SONAR and is ready to help drive your decision-making! FreightWaves’ rail ticker data was regrouped into new market definitions to give you a better picture of rail movements. The dataset covers an even larger portion of the total U.S. containerized intermodal volume and offers additional granularities with more detailed descriptions of the geographic areas those granularities cover. If you are interested in learning more or have any questions, please reach out to your Customer Success Manager or [email protected].
FreightWaves staff also fixed the bug that would put newly created custom pages at the bottom of the list…they will appear at the top now.
In addition, a bug that prevented tree-maps from being updated with new datasets has been fixed.
And finally, a bug that caused more ticker/granularity combinations to be returned in an API call than expected has been fixed.
First, a notice that we are currently rerunning the process to populate the most recent data points for:
API customers should re-pull the data you returned this morning when notice of the fix is sent via email.
The TRAC consortium is growing!
The FreightWaves’ TRAC spot rate consortium has gained new partners. This will improve the quality and quantity of the daily spot rates shown in the SONAR Market Dashboard and available via the SONAR API.
With the new members added, the FreightWaves TRAC spot rates cover over 90% of available zip3-to-zip3 lanes in the contiguous 48 states for van, and 60% for reefer. FreightWaves staff members are excited to grow this valuable dataset, and look forward to your feedback! If you are interested in learning more about the TRAC consortium, please reach out to your Customer Success Manager or [email protected].
Retired TCA Tickers
The following TCA benchmarking indices in SONAR have been retired. They have been removed from the SONAR UI and the API will no longer be supported or updated.
If you have any questions about these changes or would like additional training on the SONAR platform, please reach out to your Customer Success Manager or email [email protected] .
Based on direct customer feedback, several enhancements to the Market Dashboard have been released this week.
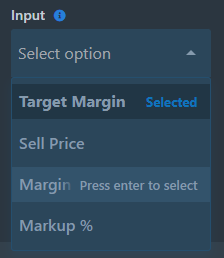
Two new input options were added to the Margin Calculator so now you can enter a Sell Price to compare to the market rates or enter your preferred cost mark-up percentage.
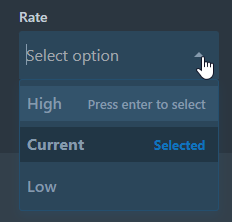
You can now select the high, low, or current rate in the margin calculator, to give you more flexibility in which TRAC rate you want to use.
In addition to some visual upgrades, to enhance the visibility of how rates are changing over time, the drop-down for the TRAC spot rates now includes 7-day and 28-day rolling average rates with the percent change compared to the previous 7- and 28-day rolling averages.
If you have any questions about this release or would like additional training on the SONAR platform, please reach out to your Customer Success Representative or email [email protected]
SCI Updates
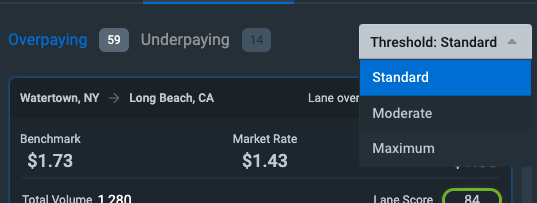
A new Threshold selection on the Opportunity view enables users to have greater visibility into the potential risk for their lanes. Choose from Standard, Moderate or Maximum to see the threshold change and level of risk for each.
New custom field options: Now you can upload a custom field for each lane and be able to interact with the UI. Filtering, searching and sorting lanes has gotten easier now that you can see them broken out by a field that you quantify.
If you have any questions about this release or would like additional training on the SONAR platform, please reach out to your Customer Success Representative or email [email protected]
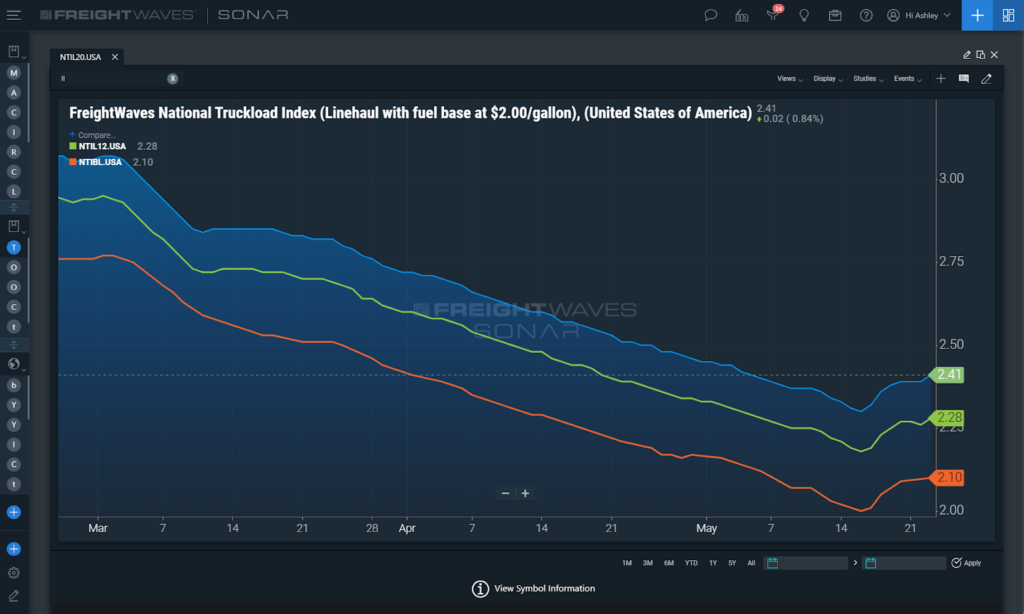
Three new National Truckload Index tickers excluding fuel
The National Truckload Index (NTI) is a national (U.S.) spot rate index based on an average of booked spot dry van loads from 250,000 lanes. These transactions originate from FreightWaves Trusted Rate Assessment Consortium (TRAC) and are reported daily.
The new linehaul-only derivatives (NTIL, NTIL12, NTIL20) give insight into how fuel costs are impacting spot rate movements and carrier margins. Read more about them here.
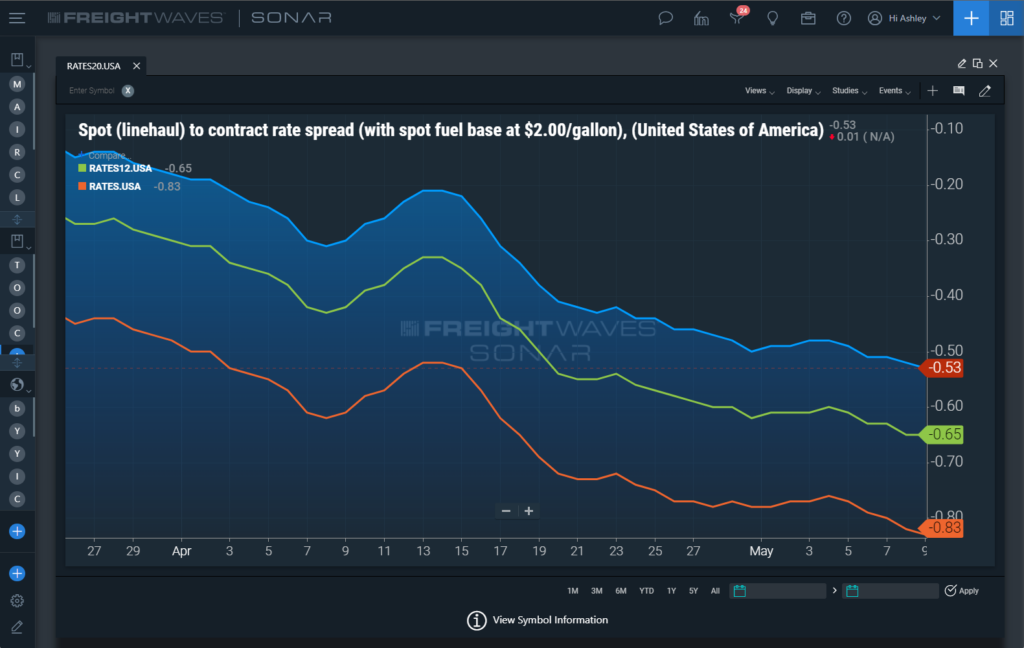
Three new RATES tickers excluding fuel
RATES, RATES12, and RATES20 show the difference between spot and contract dry van rates at a national level excluding estimated fuel costs under different assumptions.
When RATES is a positive value, trucking capacity is relatively tight with upward pressure on contract rates if sustained. If RATES is negative then there is downward pressure on contract rates. Read more about them here.
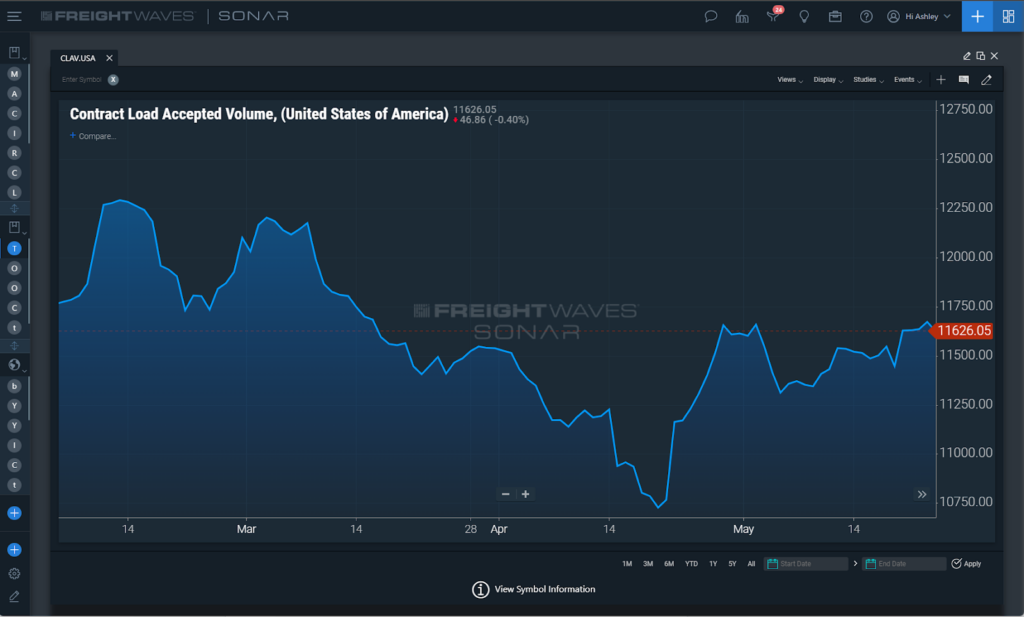
A new index for accepted contract loads
Contract Loads Accepted Volumes (CLAV) is an index that measures load volumes moving under contracted agreements.
Contracted loads are heavily skewed towards the largest shippers and carriers and represent the core of truckload demand. The CLAV index tells you when the amount of contracted freight is increasing or decreasing in the U.S. Read more about it here.
The FreightWaves TRAC Spot rates & our Capacity Lane Scores you know and love in the Market Dashboard App inside SONAR are now available through Tai, giving you even more power to let the data do the deal-making!
FreightWaves has partnered with Tai to bring SONAR to you! If you are an existing SONAR customer that has a SONAR API subscription to our Capacity Market or Lane Scores and/or FW TRAC data, simply use your existing API credentials/ token to start accessing the data. To gain access to SONAR data or learn more about FreightWaves TRAC or our capacity datasets, please contact your Customer Success Manager or [email protected].
FreightWaves’ Capacity Lane Scores provide users unique insight into the current capacity trends on a given lane. Measuring capacity is a key element to maximizing margins/transactions for a broker, utilization for a carrier, and minimizing service and budgetary failures for shippers. The capacity lane score is a measure of the origin and destination market capacities, and shows you how capacity is tightening or loosening by combining tender rejection rates and the market balance of inbound and outbound loads. Users will be able to see which lanes have the most significant tightening or loosening conditions, leading to lower costs and improved profitability.
The capacity lane score ranges from 0-100. A high score indicates that capacity is tight, and a low score indicates that capacity is loose. Increasing lane scores indicate tightening capacity with upward pressure on spot rates, and decreasing lane scores indicate loosening capacity with downward pressure on spot rates.
The spot rates are generated from FreightWaves TRAC which collects data daily from a consortium of key market-driving companies adhering to a standardized protocol. FreightWaves TRAC Spot Rate methodology uses data from when the load is covered to provide better insight into freight pricing and negotiating. The rates displayed represent the low (33rd percentile), median, and high (67th percentile) rates for a given lane and update daily.
Have questions, or would like to gain access to SONAR data in Tai? Please reach out to your Customer Success Manager or email [email protected]!
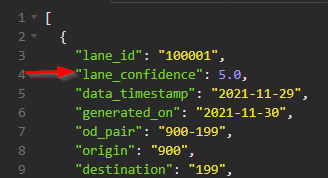
The FreightWaves TRAC Spot rate confidence score you know and love in the Market Dashboard App inside SONAR is now available in the TRAC Rates API response as lane_confidence, giving you even more power to let the data do the deal-making!
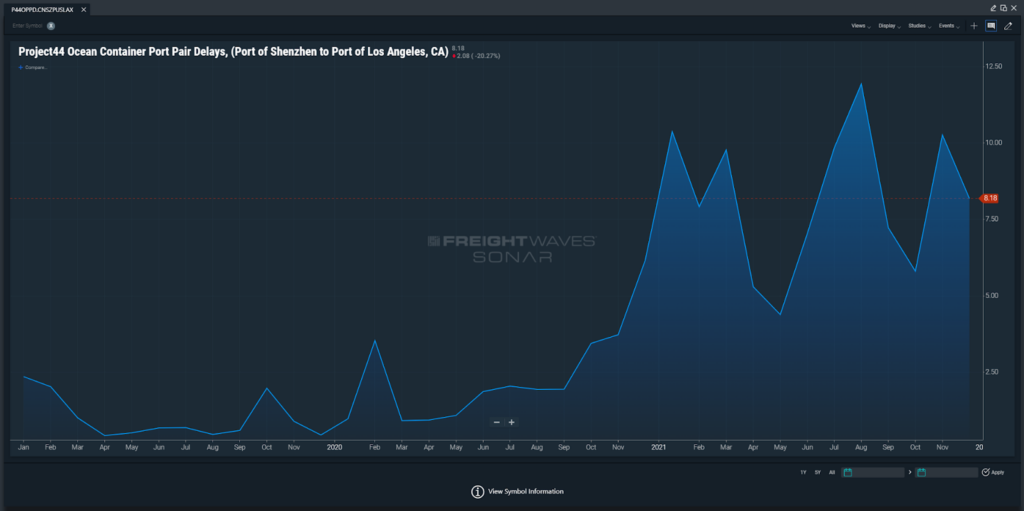
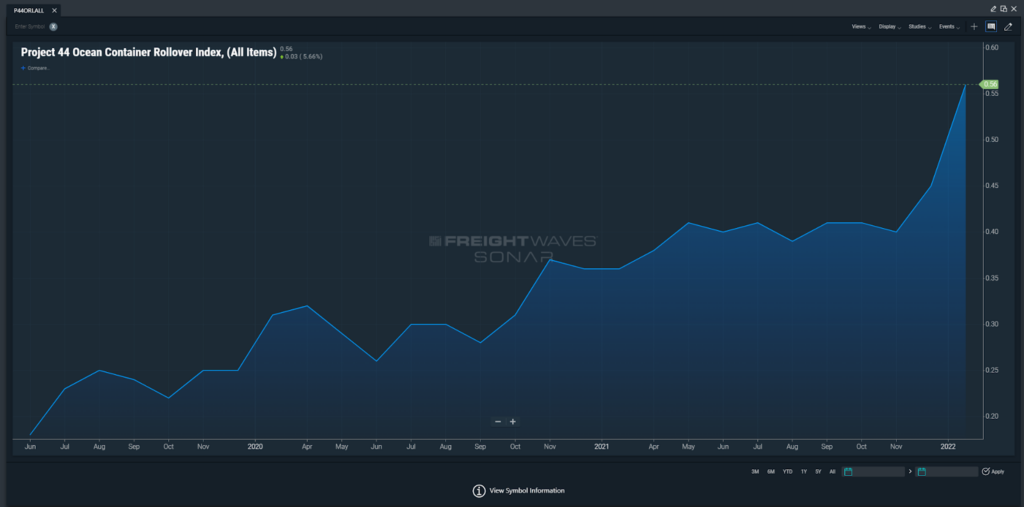
New Project44 Ocean Tickers are Now Available!
There are three new ocean cargo tickers powered by Project44 data to show shippers, international freight forwarders, ocean carriers, port authorities, drayage providers, and railroads how international ocean freight flows affect freight market dynamics!
The Project44 Ocean Container Rollover Index (SONAR: P44ORI) measures the weekly proportion of cargo departing a port on a different vessel than originally scheduled. It’s expressed as a percentage, at the port and carrier levels, and indicates how many containers are being ‘rolled’ to subsequent sailings. For more information click here.
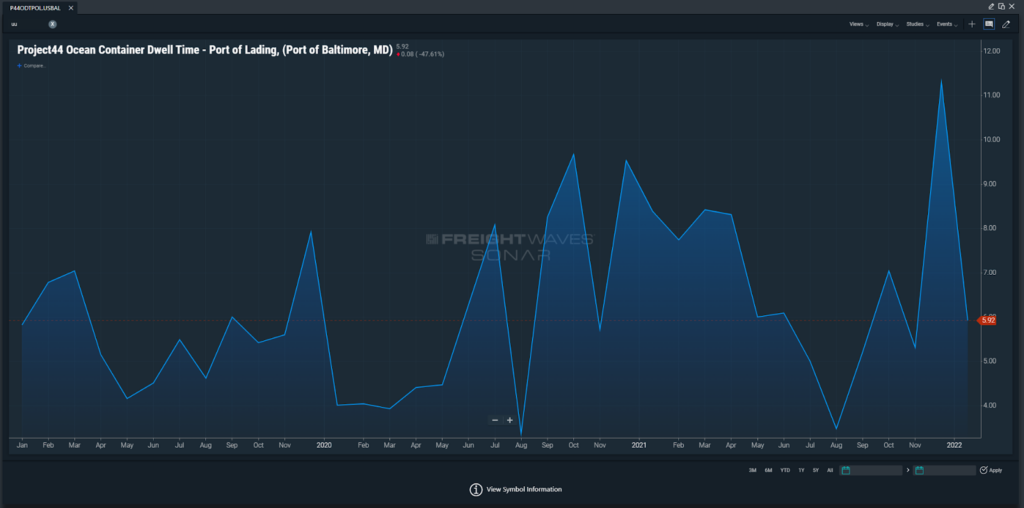
The Project44 Ocean Container Dwell Times (SONAR: P44ODTPOL, P44ODTTSP, P44ODTPOD) are a set of weekly indices that measure the average number of days ocean containers are held at ports of lading, transshipment ports, and ports of discharge. The indices provide this information for 150 major container ports globally. For more information click here.
The Project44 Ocean Container Port Pair Delays (SONAR: P44OPPD) display the average number of days between originally scheduled and actual vessel arrival dates on the world’s most important ocean container trade lanes. These Project44 Ocean Container Port Pair Delays indicate sailing schedule compliance and service reliability at a lane-level on a monthly basis. For more information click here.