A multi-lane rate management dashboard that shows the current spot and contract rates with high and low values in a lane along with a historic chart view and multiple other market analytic data points, such as origin and destination capacity conditions.
Currently, Market Dashboard Plus is an add-on feature to SONAR. If you are interested in learning more and gaining access, please reach out to your Customer Success representative or email [email protected]
WHAT DOES IT TELL ME?
Inside the Market Dashboard Plus, users have the ability to:
Upload files with up to 10,000 lanes
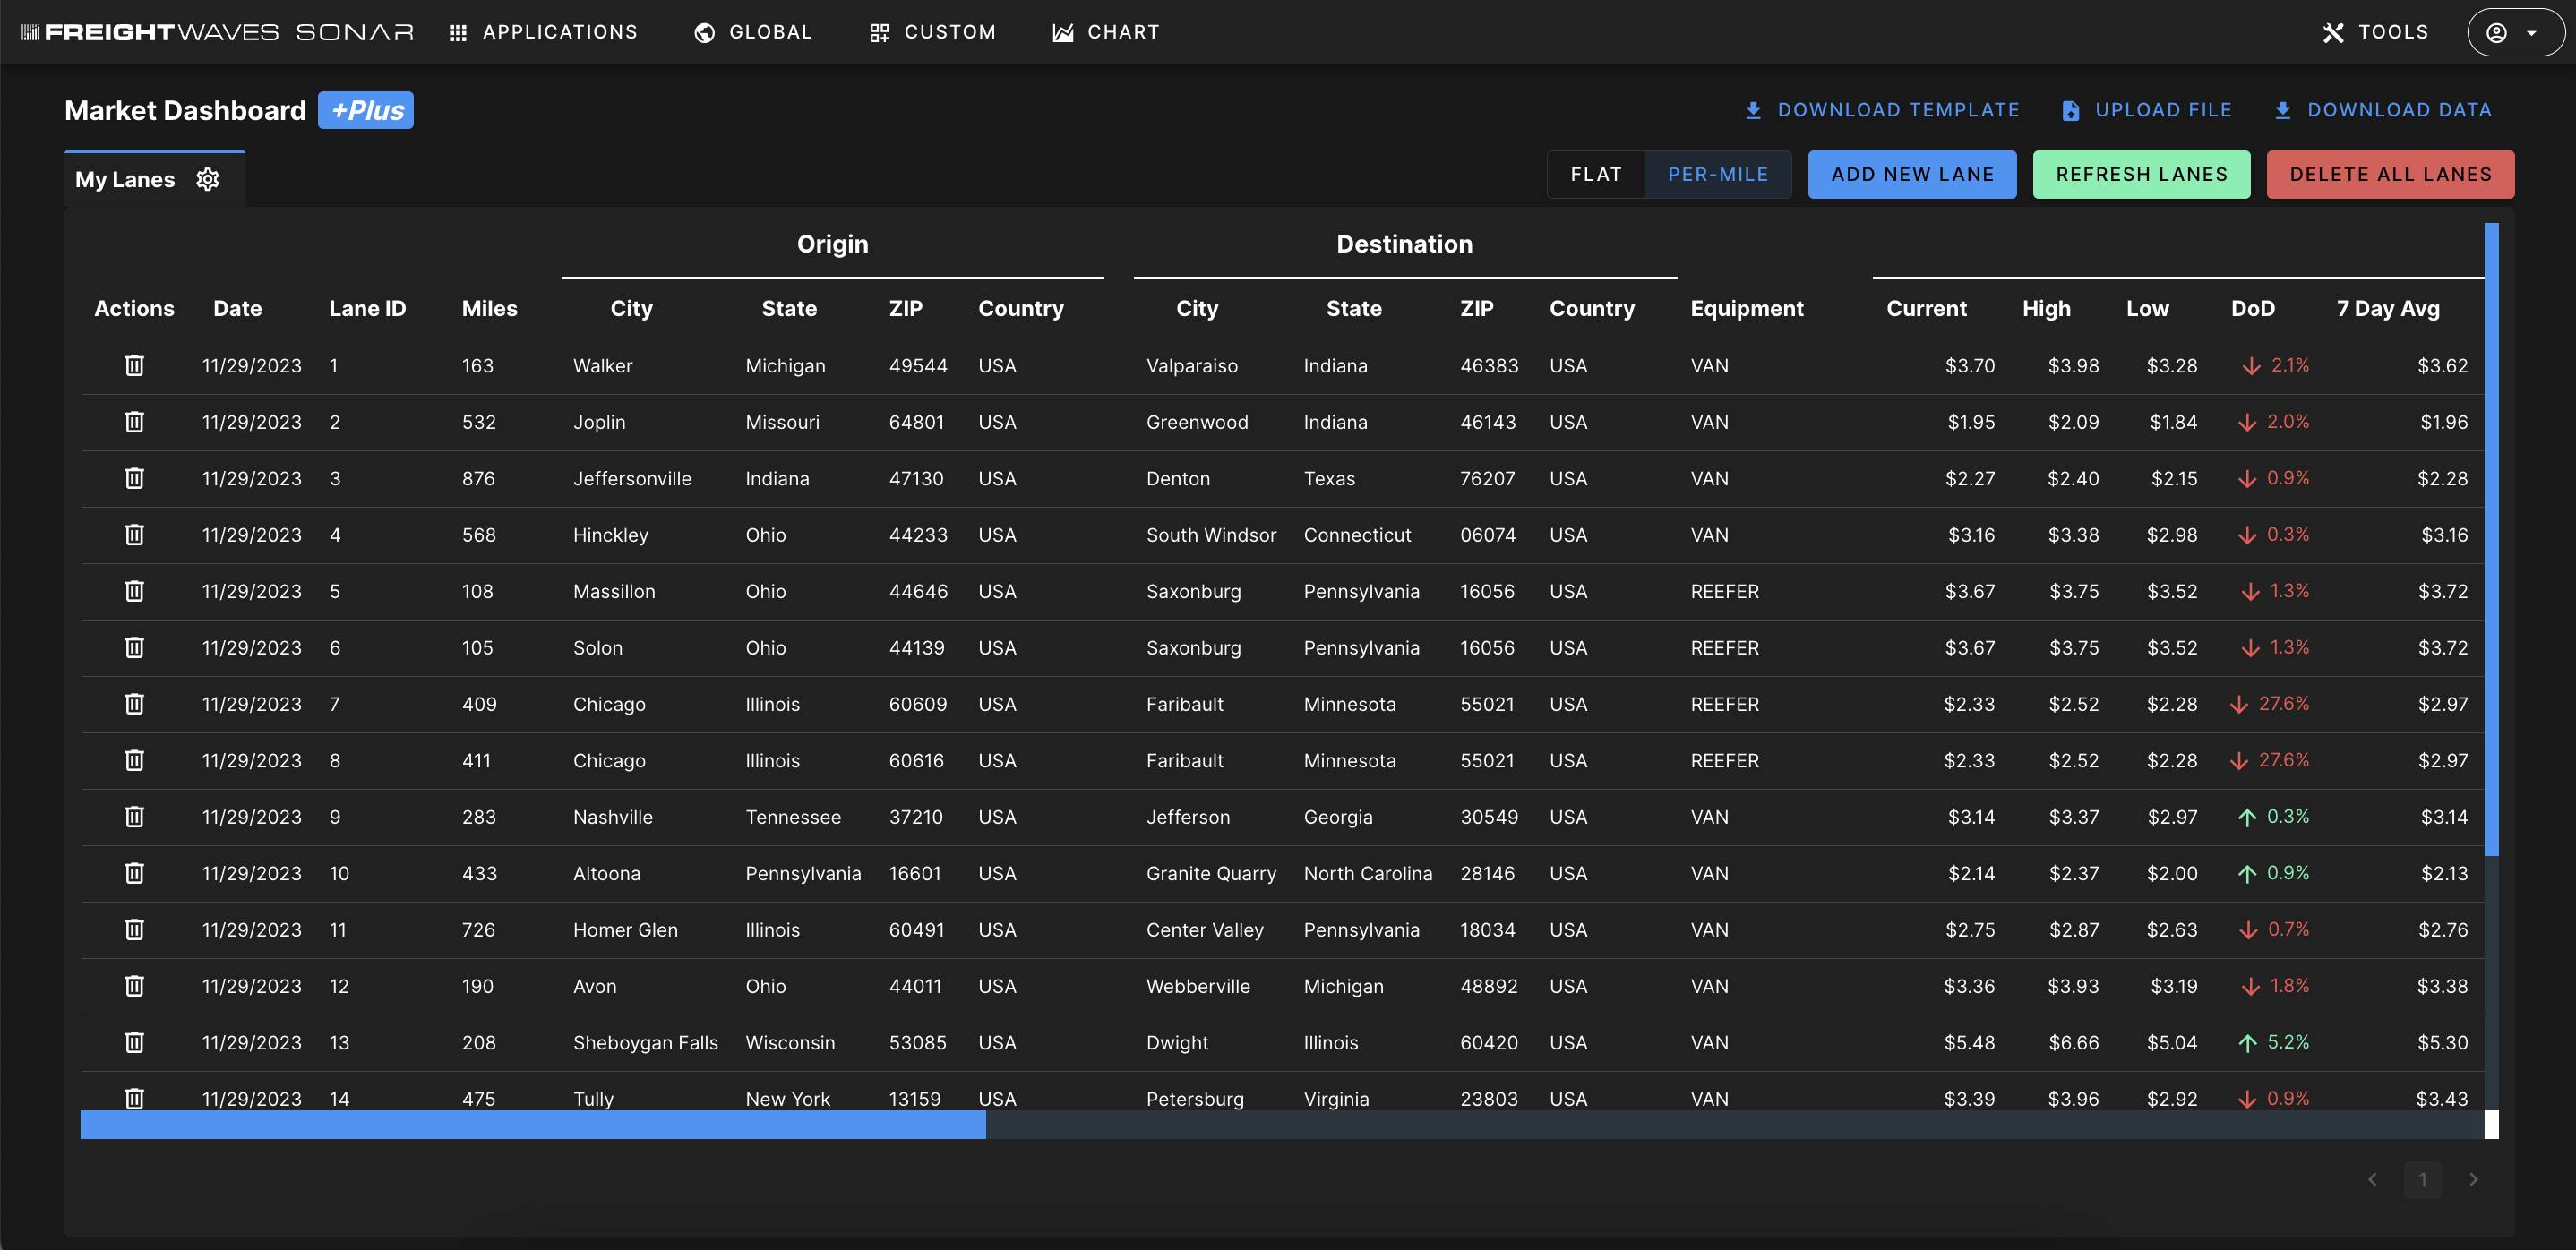
See the current van or reefer TRAC spot rate, Contract Rates (optional) and a statistical price range
See multiple data points around the TRAC spot rates:
Day-over-day change
Current, high and low value
7-Day average
Week-over-week change
28-day average
Month-over-month change
See multiple data points around the Contract rates:
Day-over-day change
Current, high and low value
90-Day average
See a chart of historical rates
View lane insights such as:
Lane Score — a value from 1-100 that indicates how easy or difficult it is to secure capacity in that lane.
0-25 = Most difficult to cover
26-40 = Difficult to cover
41-59 = Neutral
60-75 = Easy to cover
76-100 = Easiest to cover
Outbound Tender Rejection Index for the origin
Ability to save view settings
Option to export data
How to:
Click on “Market Dashboard+” under the apps section on the left side of SONAR.
If this is your first time uploading a file to Market Dashboard Plus, you will need to download the template by clicking “Download Template” in the top right corner.
After you have your file ready to be uploaded in the correct format, you will then click “Upload File” in the top right corner.
You can either drag and drop your file or click and upload
You will then see your file go through the upload process.
Once your file has uploaded you have multiple options:
You can view the data within the SONAR platform.
You can download the data into a CSV file by clicking “Download Data” in the top right corner.
You can view historical rate data for a specific lane by clicking on the chart icon on the left side of your lane.
You can delete any lanes from a file by clicking on the trashcan icon on the left side of your lane.
You can add an additional lane(s) to the file by clicking “Add a new lane.”
Each day, there will be new data for the lanes you have uploaded. This data will not be automatically refreshed, but you can do this manually by clicking “Refresh Lanes.”
If you do not want to see all the data points available, you can click on the gear icon next to “My Lanes” and unselect the ones you are not interested in.
WHO IS INTERESTED?
Anyone who is involved in truck transportation — brokers, carrier pricing, carrier sales, load planners, transportation managers