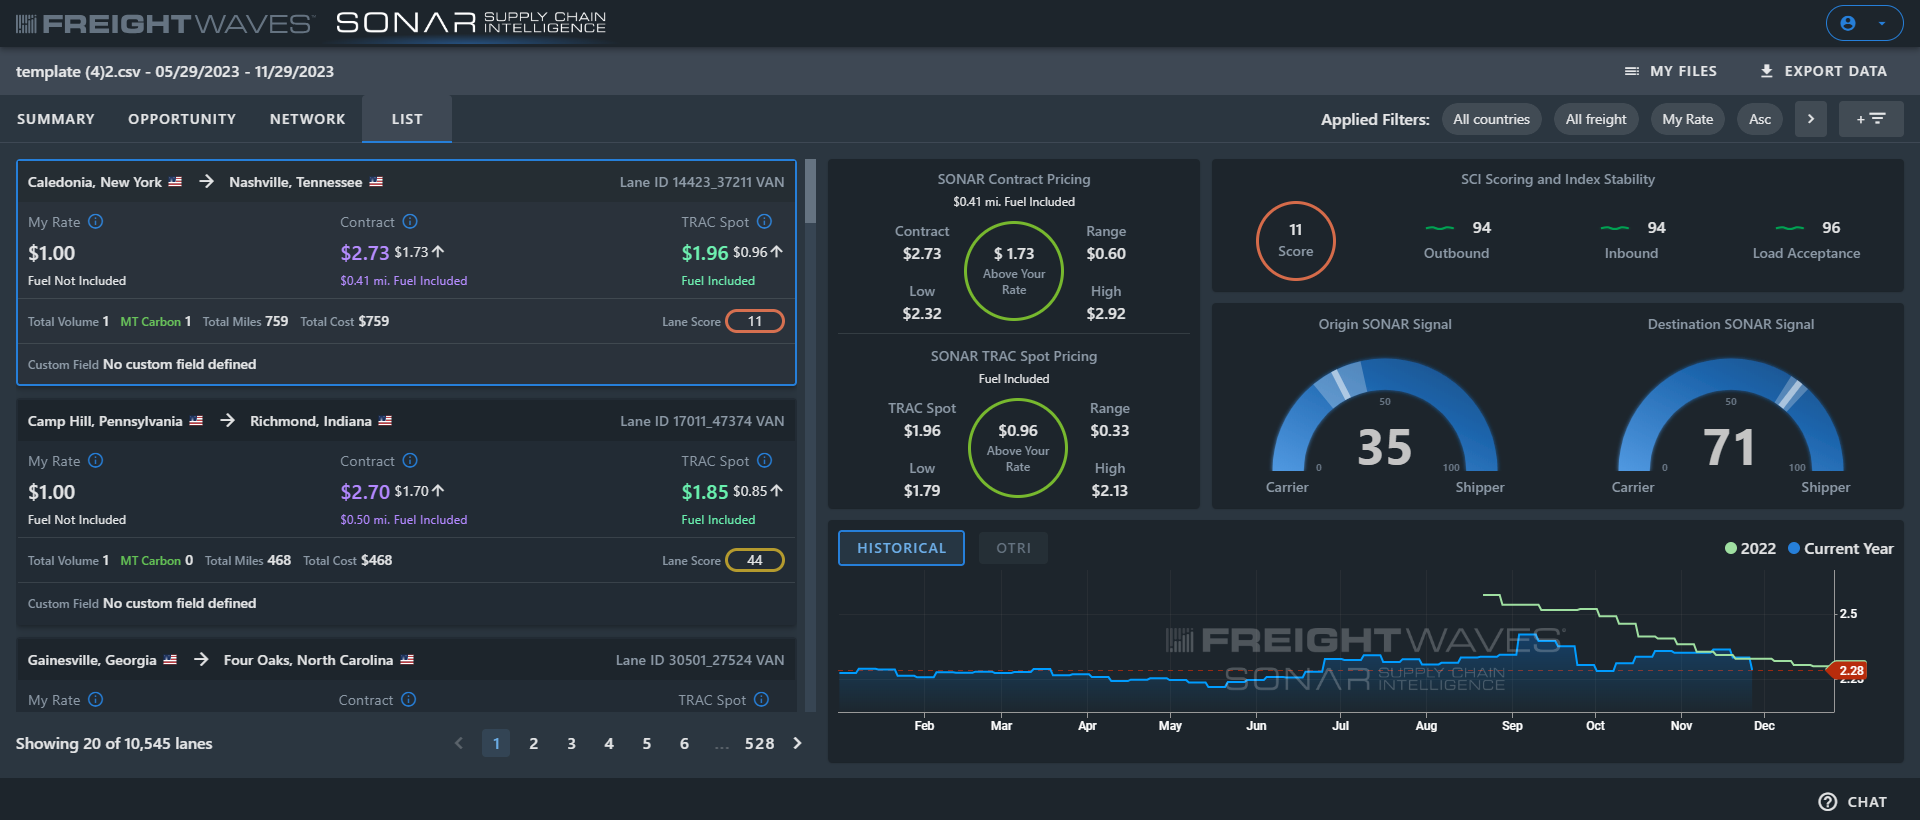
A list of each lane in the uploaded data file with all the available market-level data. This view is the most granular view available and is meant for the deepest level of analysis by lane. The lanes are sortable on the left side of the page. Additional detail is displayed on the right side of the page by clicking on the individual lanes.
The following data points are available for each lane on this page:
Benchmark Rate – The linehaul rate per mile uploaded by the user for the lane.
Market Rate – The average market rate in the lane based on the FreightWaves contract rate database.
TRAC Spot Rate – is the average spot market rate in the lane based on the TRAC consortium
Lane Score – A score based on a scale from 1-100 that is derived from tender data and measures how tight or loose a lane is or how easy or difficult it is to find capacity relative to the rest of the market. High lane scores indicate relatively loose capacity or easier procurement conditions, whereas low lane scores indicate more difficult procurement situations.
SONAR Market/TRAC Pricing – This box shows the range of contract and spot prices reported for both market and TRAC data.
Outbound/Inbound Stability – A measure of volatility of the capacity of the outbound/inbound market. Higher scores indicate a low frequency of changing capacity conditions over the stated period of time.
Load Acceptance – The average load acceptance rate for the selected lane in terms of contract compliance. Higher values indicate higher load acceptance rates.
Origin/Destination SONAR Signals – A score derived from a combination of market balance and tender rejection rates. A higher score indicates easier coverage or looser capacity, while a low score indicates the opposite.
A chart that shows historical contract rate and outbound tender rejection rate changes over the past 18 months is visible on the bottom right of the page.