Spot (linehaul) to contract rates spread (RATES)

WHAT IS IT?

The spot to contract linehaul spread (or RATES) is the difference between the initially reported dry van contract rate per mile (VCRPM1) and the FreightWaves National Truckload Index – Linehaul Only (NTIL). 

Here is the formula: FreightWaves National Truckload Index (Linehaul only) minus the Initially Reported Dry Van Contract Rate

WHO IS INTERESTED?

Analysts can use RATES to understand how pricing behaviors are changing. This will allow for understanding of the direction that contract prices are going to face, which can in turn affect revenue estimates for truckload carriers, which primarily operate in the contract market. 


Carriers can use RATES to determine if the optionality that spot market provides is worth rejecting contracted volume. When RATES.USA turns positive, spot market pricing is at a premium to current contract rates, allowing for carriers to shop the spot market for more favorable rates. When RATES.USA is deeply negative, spot market rates are operating at a discount to contract rates, an indication that carriers should limit spot market activity.


Brokers: Understanding RATES.USA is paramount to a broker’s business. The spread between contract and spot rates is the spread between a broker’s “buy” and “sell” price. When RATES.USA is deeply negative, brokers “buy” rate, the rate at which capacity is purchased is much lower than the “sell” rate, which they charge customers, thus wider gross margins. When RATES.USA is positive (or slightly negative), the “buy” rate is much closer to the “sell” rate and sometimes above it, thus margins are squeezed.

Shippers: RATES.USA can be used for multiple purposes. When RATES.USA is deeply negative, strategically placing freight in the spot market can allow for cost savings compared to contract rates. At the same time, it is a signal of downward pressure on contract rates. When RATES.USA is positive, shippers should avoid the spot market and expect that contract rates are going to move higher if the index is positive for an extended period of time.

WHAT DOES IT TELL ME?

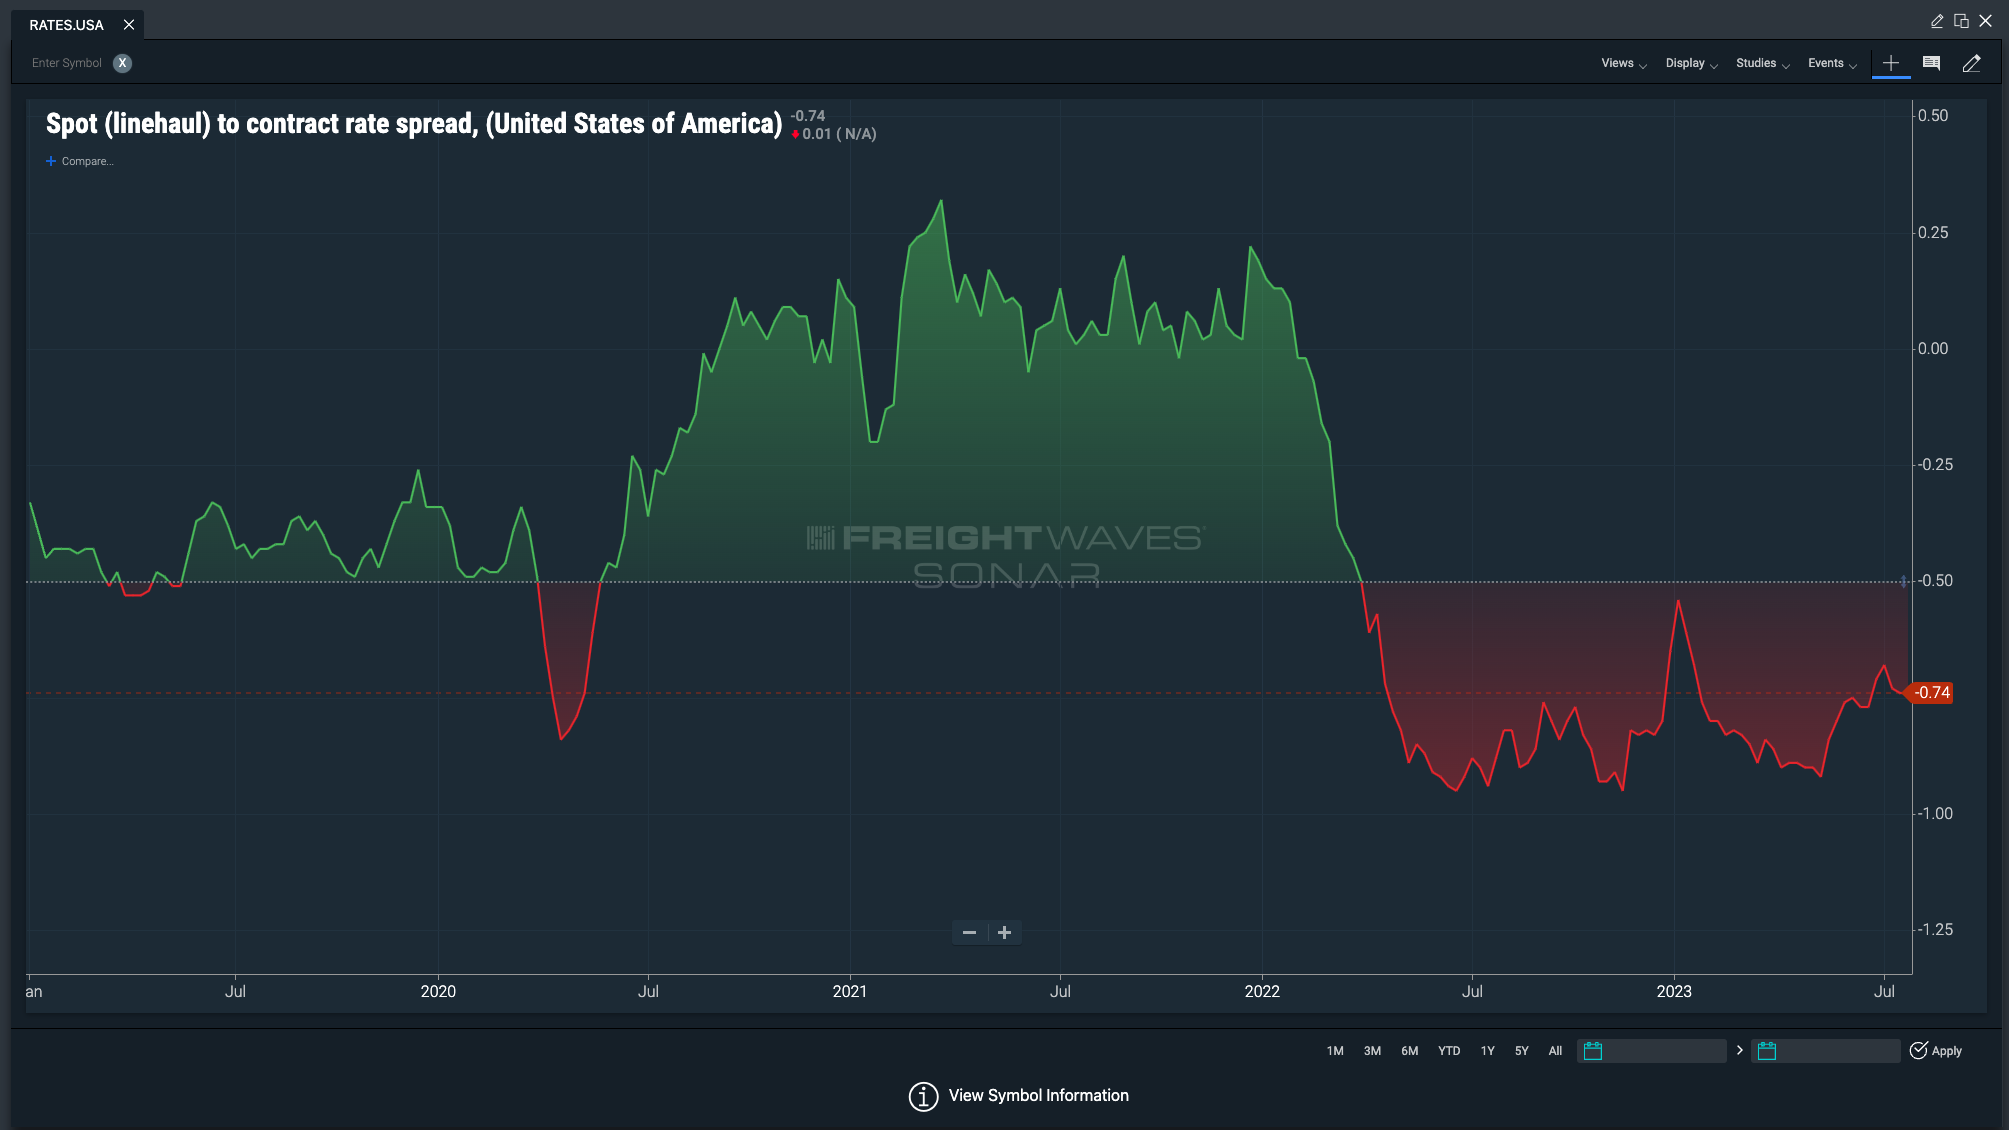
On the surface, RATES provides a snapshot of which direction pricing is heading in the freight market. The spread typically operates within a range of negative 30 cents per mile and negative 50 cents per mile. The RATES index can only move if either one, or both, of the following happen: contract rates increase/decrease or spot rates increase/decrease. 


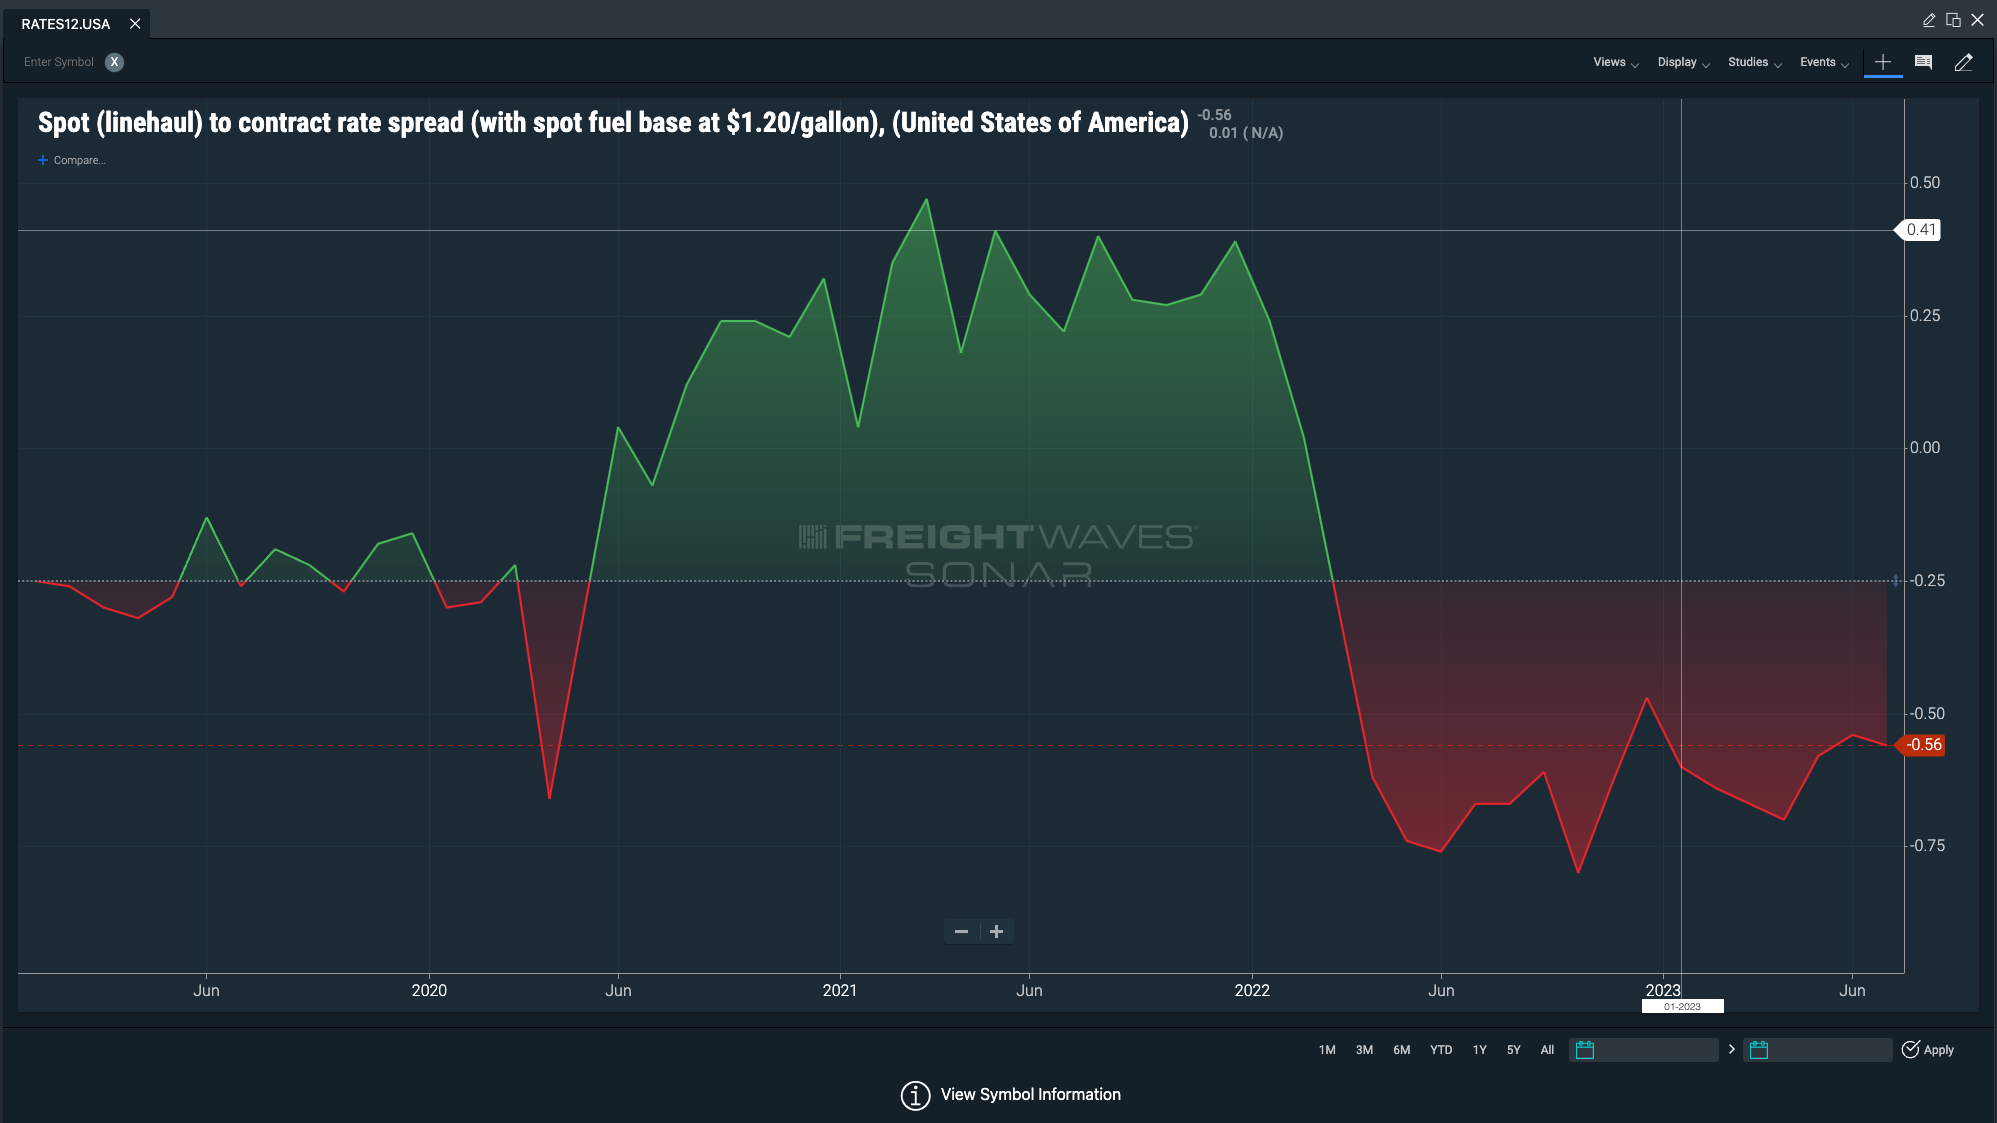
The Spot to Contract Linehaul Spread can be broken down into the following indices:

  • RATES.USA – Spot (linehaul) to contract rate spread
  • RATES12.USA – Spot (linehaul) to contract rate spread (with spot fuel base at $1.20 per gallon)
  • RATES20.USA – Spot (linehaul) to contract rate spread (with spot fuel base at $2.00 per gallon)


Quick Tutorial on how to use RATES

  1. View the RATES index in a chart to see trends in the spread between spot and contract rates on a national level.

SONAR Ticker: RATES12.USA


  1. Use the baseline view and place the baseline at a range, within the negative 30 cents per mile and negative 50 cents per mile, which is the normal operating range of the spread. 
  2. When the spread crosses over either bound of the negative 30 cents per mile and negative 50 cents per mile, longer term contract pricing start to come under pressure

SONAR Guides Freight Market Participants


Whether they realize it or not, many freight market participants are relying on stale and narrow data to make critical freight decisions. Freightwaves SONAR provides the freshest and most comprehensive view of the ($9.6T) freight market so freight market participants can mitigate risks and protect their margins while providing the highest levels of service.


Search Knowledge Center

Related Topics

Key Market Areas (KMAs)

National Truckload Index (NTI, RTI, FTI)

FreightWaves TRAC (Trusted Rate Assessment Consortium) Spot Rates

Not Sure Where To Start?