National Truckload Index (NTI, RTI, FTI)

WHAT IS IT?

A national (U.S.) spot rate index based on an average of booked spot loads originating from FreightWaves Trusted Rate Assessment Consortium (TRAC) and are reported daily. The values are inclusive of fuel and exclude loads moving less than 250 miles. All contributors are held to standardized reporting procedures that are similar to those used in the financial industry. It is offered in multiple forms and modes including Dry Van (NTI), Reefer (RTI) and Flatbed (FTI):

  • Dry Van
    • NTI.USA A 7-day moving average
    • NTID.USA A daily average 
    • NTIB.USA A daily business day average (excludes volatile weekend submissions)
    • NTIL.USA A 7-day moving average of the daily spot rate less the estimated cost of fuel. Fuel costs are based on the average retail price of diesel fuel and fuel efficiency of 6.5 miles per gallon. The formula is NTID – (DTS.USA/6.5)
    • NTIBL.USA A daily business day average less the estimated cost of fuel.
    • NTIL12.USA A 7-day moving average less the estimated cost of fuel with a base rate of $1.20 per gallon. The formula is: NTI- ((DTS.USA – 1.2)/6.5)
    • NTIL20.USA A 7-day moving average less the estimated cost of fuel with a base rate of $2 per gallon. The formula is: NTI – ((DTS.USA – 2)/6.5) 
    • NTIF.USA – FreightWaves National Truckload Index Forecast 
      • 30 day forecast of NTI looking out from today. This will be completely overwritten daily with the updated day’s forecast.
    • NTIF7.USA – FreightWaves National Truckload Index Forecast, 7-Day Outlook
      • History of 7 day forecast for NTI – this series reflects the forecasted NTI value that was estimated 7 days prior to the date of the observation. e.g. the value shown on 7/8/22 was the 7 day forecast produced on 7/1/22.
    • NTIF14.USA – FreightWaves National Truckload Index Forecast, 14-Day Outlook
      • History of 14 day forecast for NTI – this series reflects the forecasted NTI value that was estimated 14 days prior to the date of the observation. e.g. the value shown on 7/15/22 was the 14 day forecast produced on 7/1/22.
    • NTIF28.USA – FreightWaves National Truckload Index Forecast, 28-Day Outlook
      • History of 28 day forecast for NTI – this series reflects the forecasted NTI value that was estimated 28 days prior to the date of the observation. e.g. the value shown on 7/29/22 was the 28 day forecast produced on 7/1/22.
  • Reefer
    • RTI.USA – A 7-day moving average
  • Flatbed
    • FTI.USA – A 7-day moving average


WHO IS INTERESTED?

Anyone that has an interest in trucking market activity in the United States.

WHAT DOES IT TELL ME?

Truckload spot rates are one of the first places that display supply and demand imbalance in trucking transportation. The trucking industry is typically one of the first places to notice broader changes in the U.S. economy. When demand for goods increases rapidly, spot rates follow suit; conversely when demand eases, spot rates fall. Dry van is used as the transportation mode because it represents the majority (~70%) of U.S. truckload movements and is pervasive throughout every market.

Spot rates also show seasonal trends over the course of a year. The magnitude of the movement of the NTI can be indicative of broader economic changes. Slower changes to the longer running trends are more indicative of supply side conditions, whereas demand shifts tend to move the index sharply. 

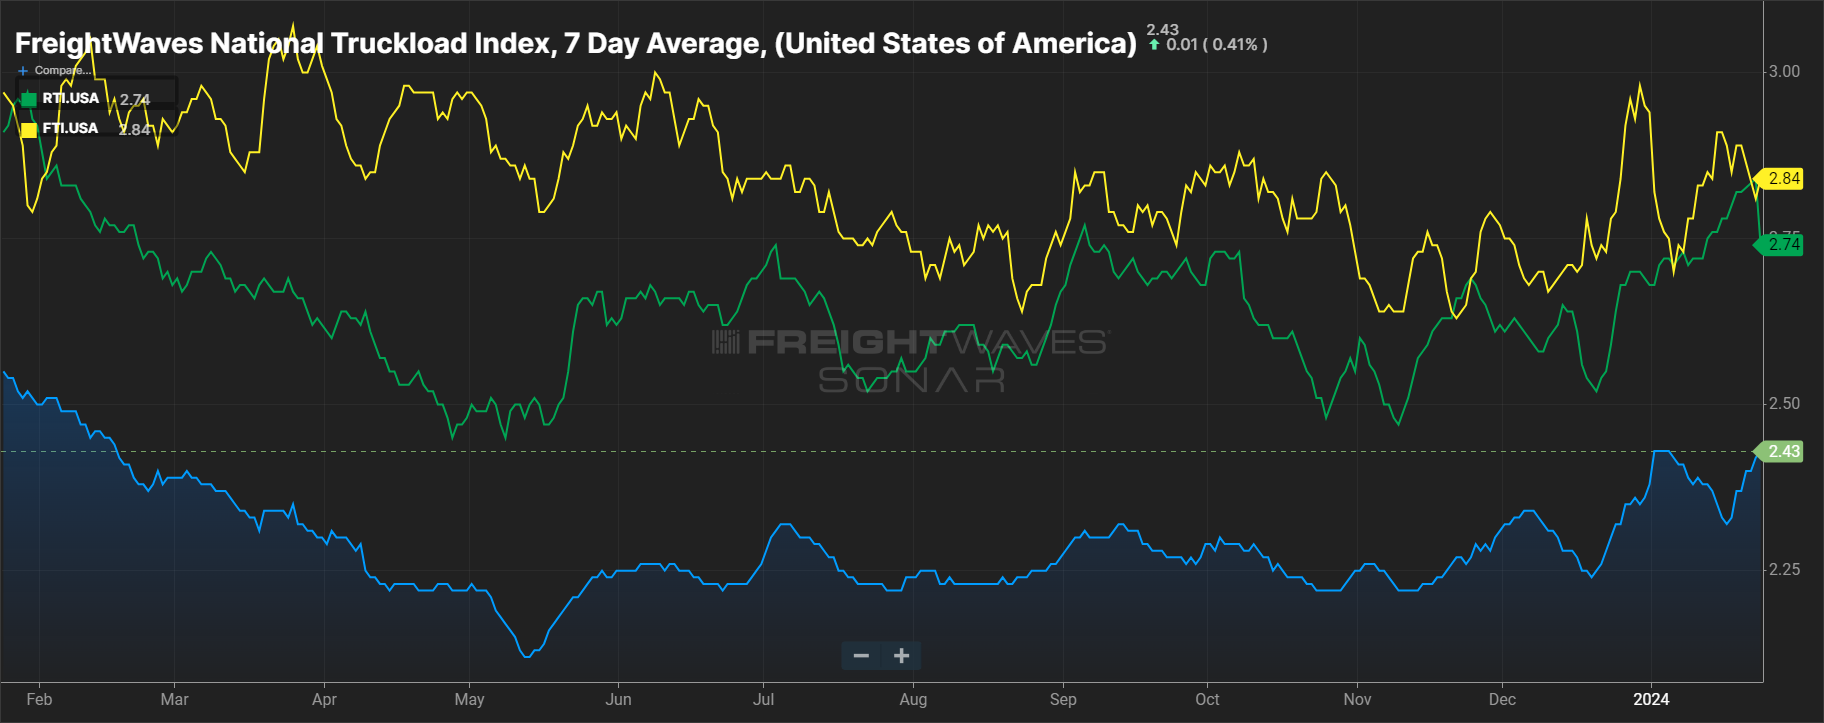
Reefer spot rate movements (RTI) are signals for supply and demand imbalance with temperature controlled freight. Flatbed spot rate movements (FTI) are signals for supply and demand imbalance with flatbed freight. When rates increase there is typically more demand than supply, when rates decrease there is more supply than demand. Flat trends represent stability or consistency in the market.

The linehaul-only derivatives (NTIL, NTIL12, NTIL20) give insight into how fuel costs are impacting spot rate movements and carrier margins.

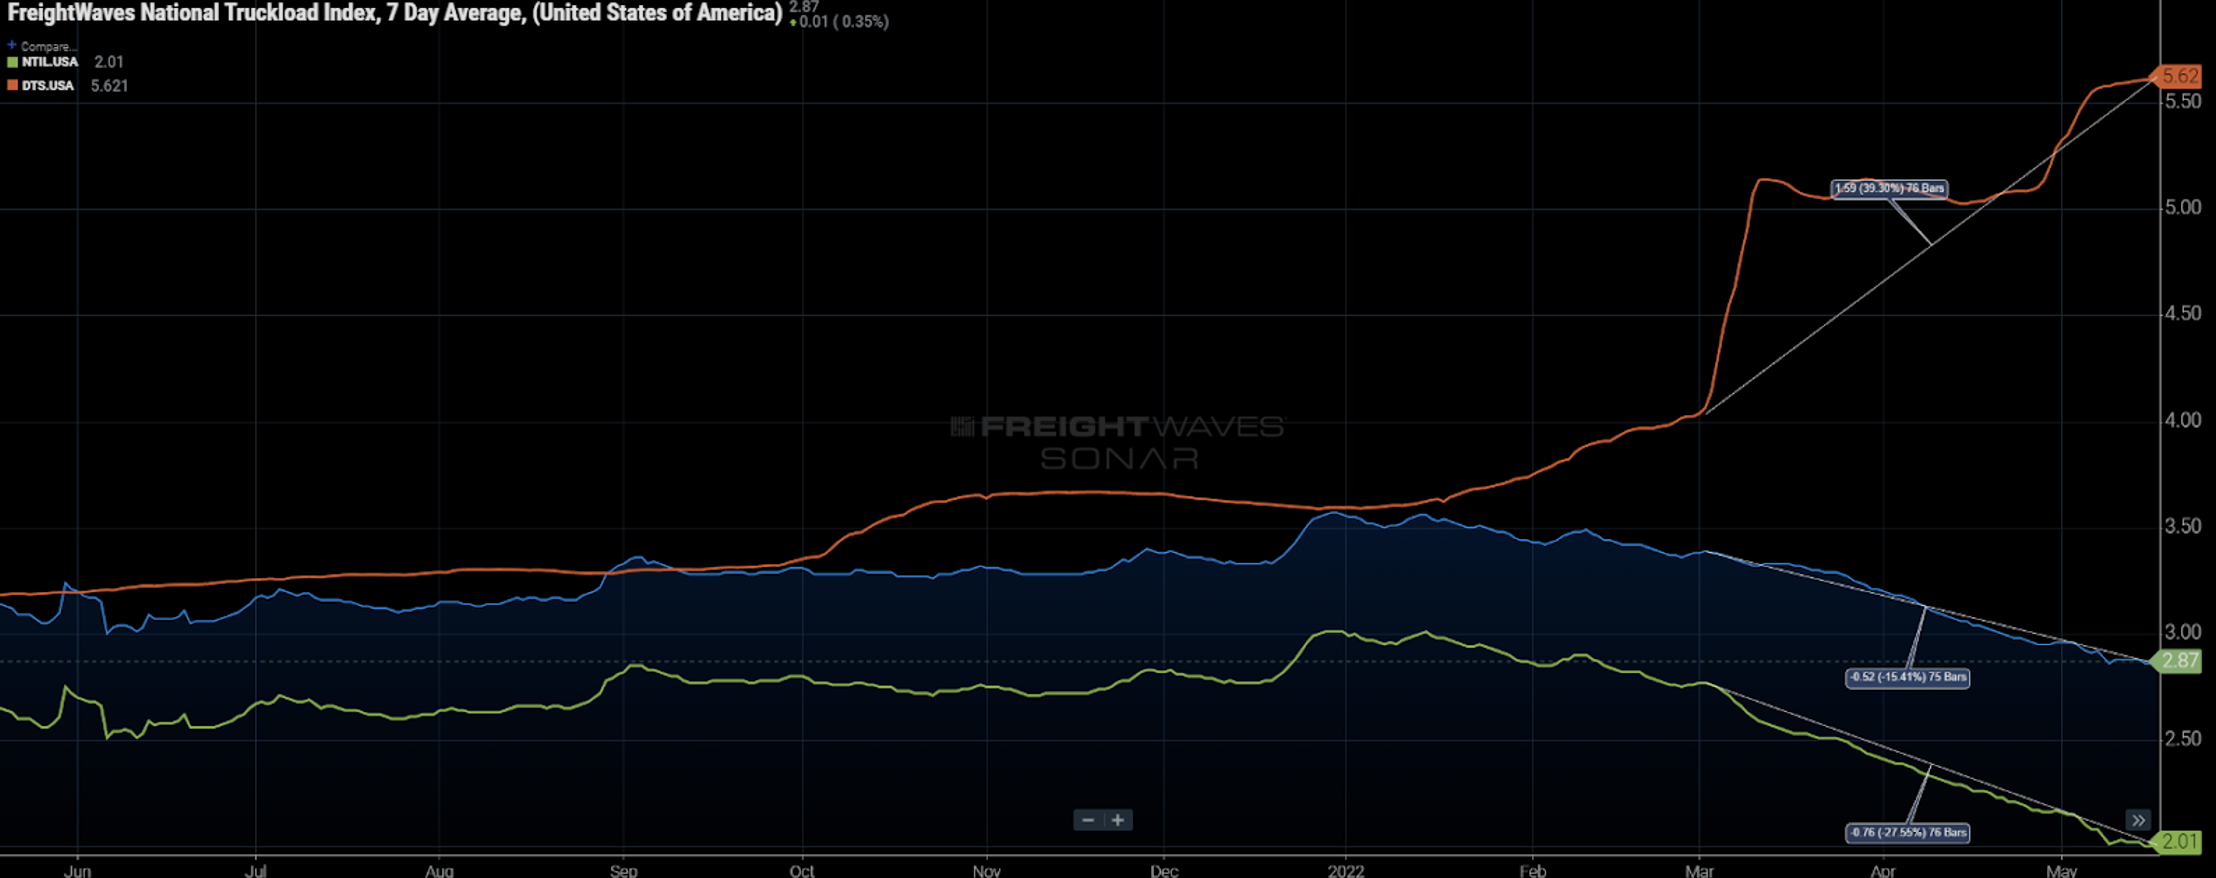
If spot rates are falling as fuel costs are rising, carrier margins are decreasing faster than the nominal rate implies and therefore the market is changing faster than it seems. In the chart above, NTIL fell 27.5% from March 2 to May 16 of 2022 while NTI fell only 15%. During this period retail fuel costs (DTS.USA) increased 40%, meaning carriers were dropping prices regardless of the inflationary pressure on their underlying costs. NTIL12 and NTIL20 estimate a higher fuel cost burden in the base rate.


Search Knowledge Center

Related Topics

Key Market Areas (KMAs)

Spot (linehaul) to contract rates spread (RATES)

FreightWaves TRAC (Trusted Rate Assessment Consortium) Spot Rates

Not Sure Where To Start?