


![macro freight markets]](https://knowledge.gosonar.com/wp-content/uploads/2024/05/macro-freight-markets.png)


SONAR KMA Rates
When it comes to moving freight from Point A to Point B, rates can vary based on capacity conditions, equipment type, lane distance, and the

When it comes to moving freight from Point A to Point B, rates can vary based on capacity conditions, equipment type, lane distance, and the

The Monthly Market Update is SONAR’s comprehensive view of the freight market, combining macroeconomic trends, industry activity, and mode-specific insights across truckload, intermodal, maritime,

Turn Your Load Board Into a Live, Data-Driven Workflow Coverage Guide Connect allows you to send your loads directly from your internal systems into

The Rail Carload Dashboard brings together operational rail metrics, commodity flows, and macroeconomic signals into a single, easy-to-navigate view. This allows you to: Identify

SONAR’s new Fuel Dashboard brings together the most important fuel and energy indicators into one unified view, helping freight professionals understand how energy markets

The Ocean Commodity Details is the latest innovation within SONAR’s Container Atlas, designed to give supply chain leaders unmatched visibility into global ocean trade.
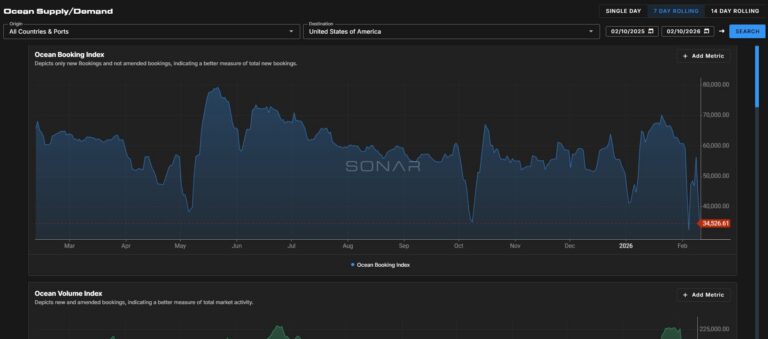
The Ocean Supply/Demand provides a consolidated view of booking volumes, carrier acceptance behavior, lead times, transit performance, and port pair reliability. It helps users quickly

The Executive Dashboard delivers an instant, powerful high-level view of the freight market as soon as you log into SONAR. This allows you

Ocean and Air Rates Dashboard; powered by Freightos SONAR’s new Freightos integration brings real-time global ocean and air pricing into a unified dashboard, expanding

For more than six years, SONAR tender data has been the trusted standard for understanding U.S. truckload demand, capacity conditions, and network performance. Our

If you are a carrier Blue To Blue helps you route smarter to earn more. You know the road. Blue To Blue knows the

The SONAR and Truckstop integration delivers on-the-spot market insights directly inside the Truckstop web application and more. Users can access key SONAR data without

The Bannon Report & SearchCarriers Protect your business and make smarter, safer decisions with two powerful new integrations accessible directly in SONAR. The Bannon Report

Overview SONAR is the freight industry’s only purpose built data platform. Specifically focused on being the most comprehensive and forward-looking freight market intelligence platform. SONAR

SONAR has integrated Genlogs into the Supply Chain Intelligence (SCI) platform, empowering shippers and logistics professionals to find the right service provider, faster, smarter, and

The new Quick Rates Extension brings SONAR’s market intelligence directly into your browser, giving you the speed and confidence to quote smarter without breaking your

The new Intermodal Dashboard empowers shippers to make data-driven mode decisions by consolidating truckload, intermodal, and maritime data into one intuitive view. This tool highlights

Managing freight costs and navigating market volatility just got easier. Cass and SONAR have partnered to deliver seamless access to your truckload cost and volume

Rate Intelligence is a comprehensive solution for rate analysis designed for anyone involved in planning or procuring trucking transportation. A rate management dashboard that

In a freight landscape teeming with opportunities, brokers need precise insights to focus their sales efforts. Sales Guide is your strategic tool to identify

The LTL datasets are Monthly indices based on the Cost per Hundred Weight for 4 NMFC freight class groupings and 5 different mileage bands. These