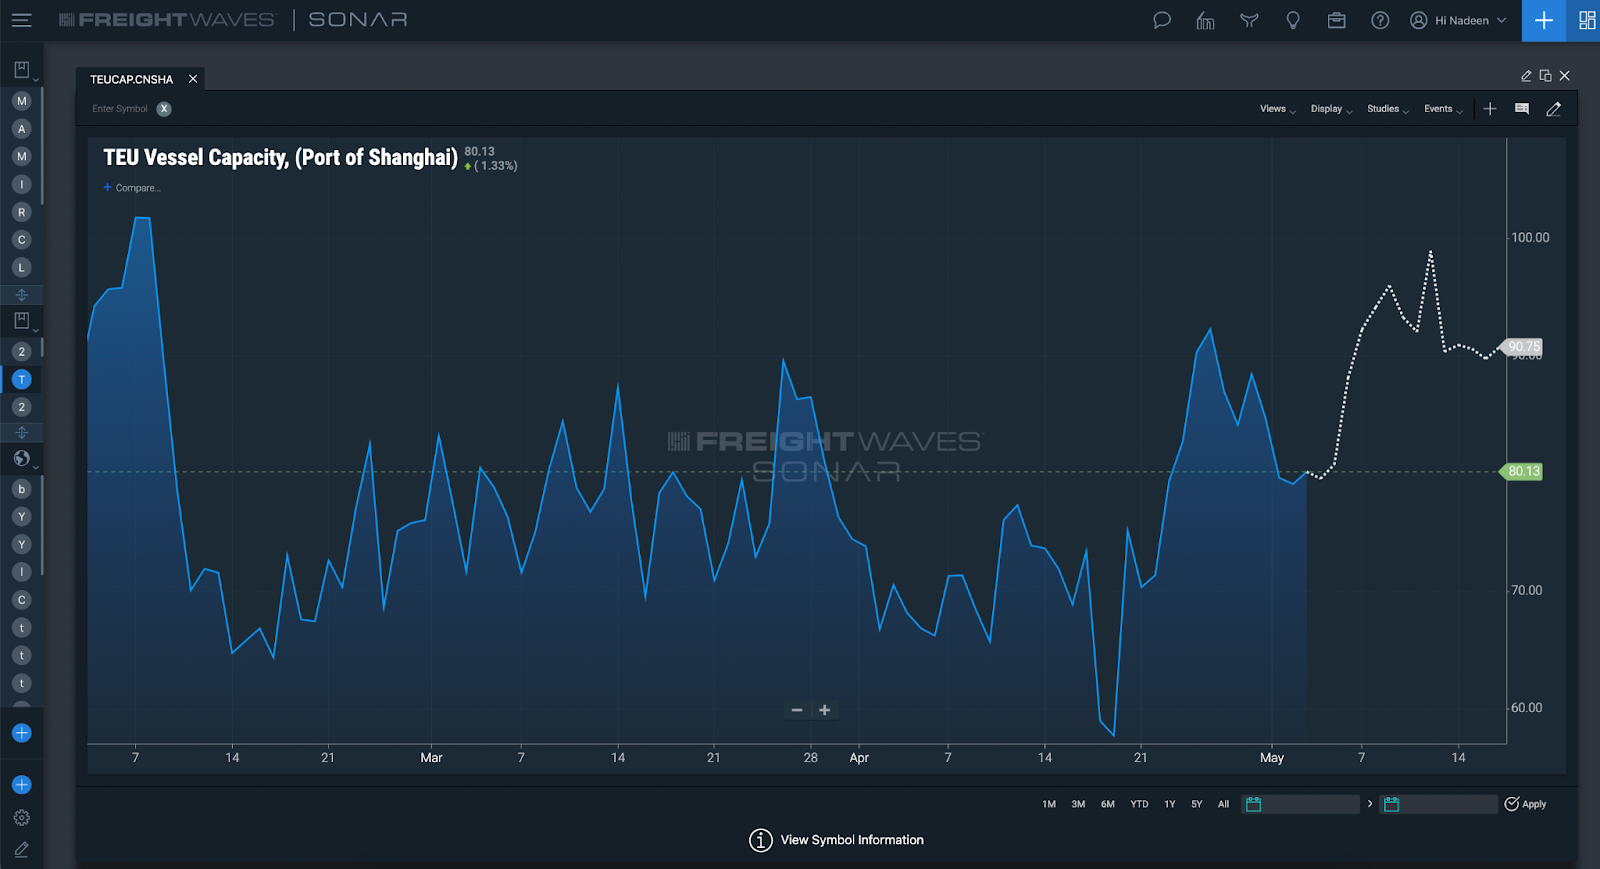
7 Day moving average of twenty-foot equivalent (TEU) vessel capacity calling a specific port of lading (POL). The date that is used for each index value is the actual date of departure from the POL. For any data that is forward-looking, the date is based on the estimated time of departure until that vessel actually departs, at which point, the date is substituted for the vessel’s actual time of departure. These future values are not a forecast but capacity expectations based on the estimated times of departure for each vessel based on bookings data.
Anyone that has an interest in ocean container capacity departing from a specific country of origin, port of lading, country to country trade lane, or port to port trade lane.
This tells a user how containerized vessel capacity is trending from a specific country of origin, port of lading, country to country trade lane, or port to port trade lane. Rather than relying on historical data, or data estimated based on ocean container carriers service routings and allocations, users can monitor containerized vessel capacity in real-time based on the vessels’ most recent and updated actual times of departure (or estimated times of departure for forward-looking data).
Example: A user wants to see how vessel capacity is trending at a specific port based on congestion and/or localized operational disruptions (i.e. labor strike, pandemic-related shutdown, etc.). If the port of interest was Shanghai in China, the user would look up TEUCAP.CNSHA to see the moving 7 day average of containerized (TEU) vessel capacity calling that port. If the index was trending down, that would tell the user that TEU vessel capacity was indeed being impacted by the disruptions, and that space was likely to get tighter if volumes remain the same or increase. This would cause a scenario where there would also be upward pressure being put on spot market rates from that specific port (and possibly nearby ports within that country of origin – in this case, China).