Supply Chain Intelligence (SCI)

WHAT IS IT?

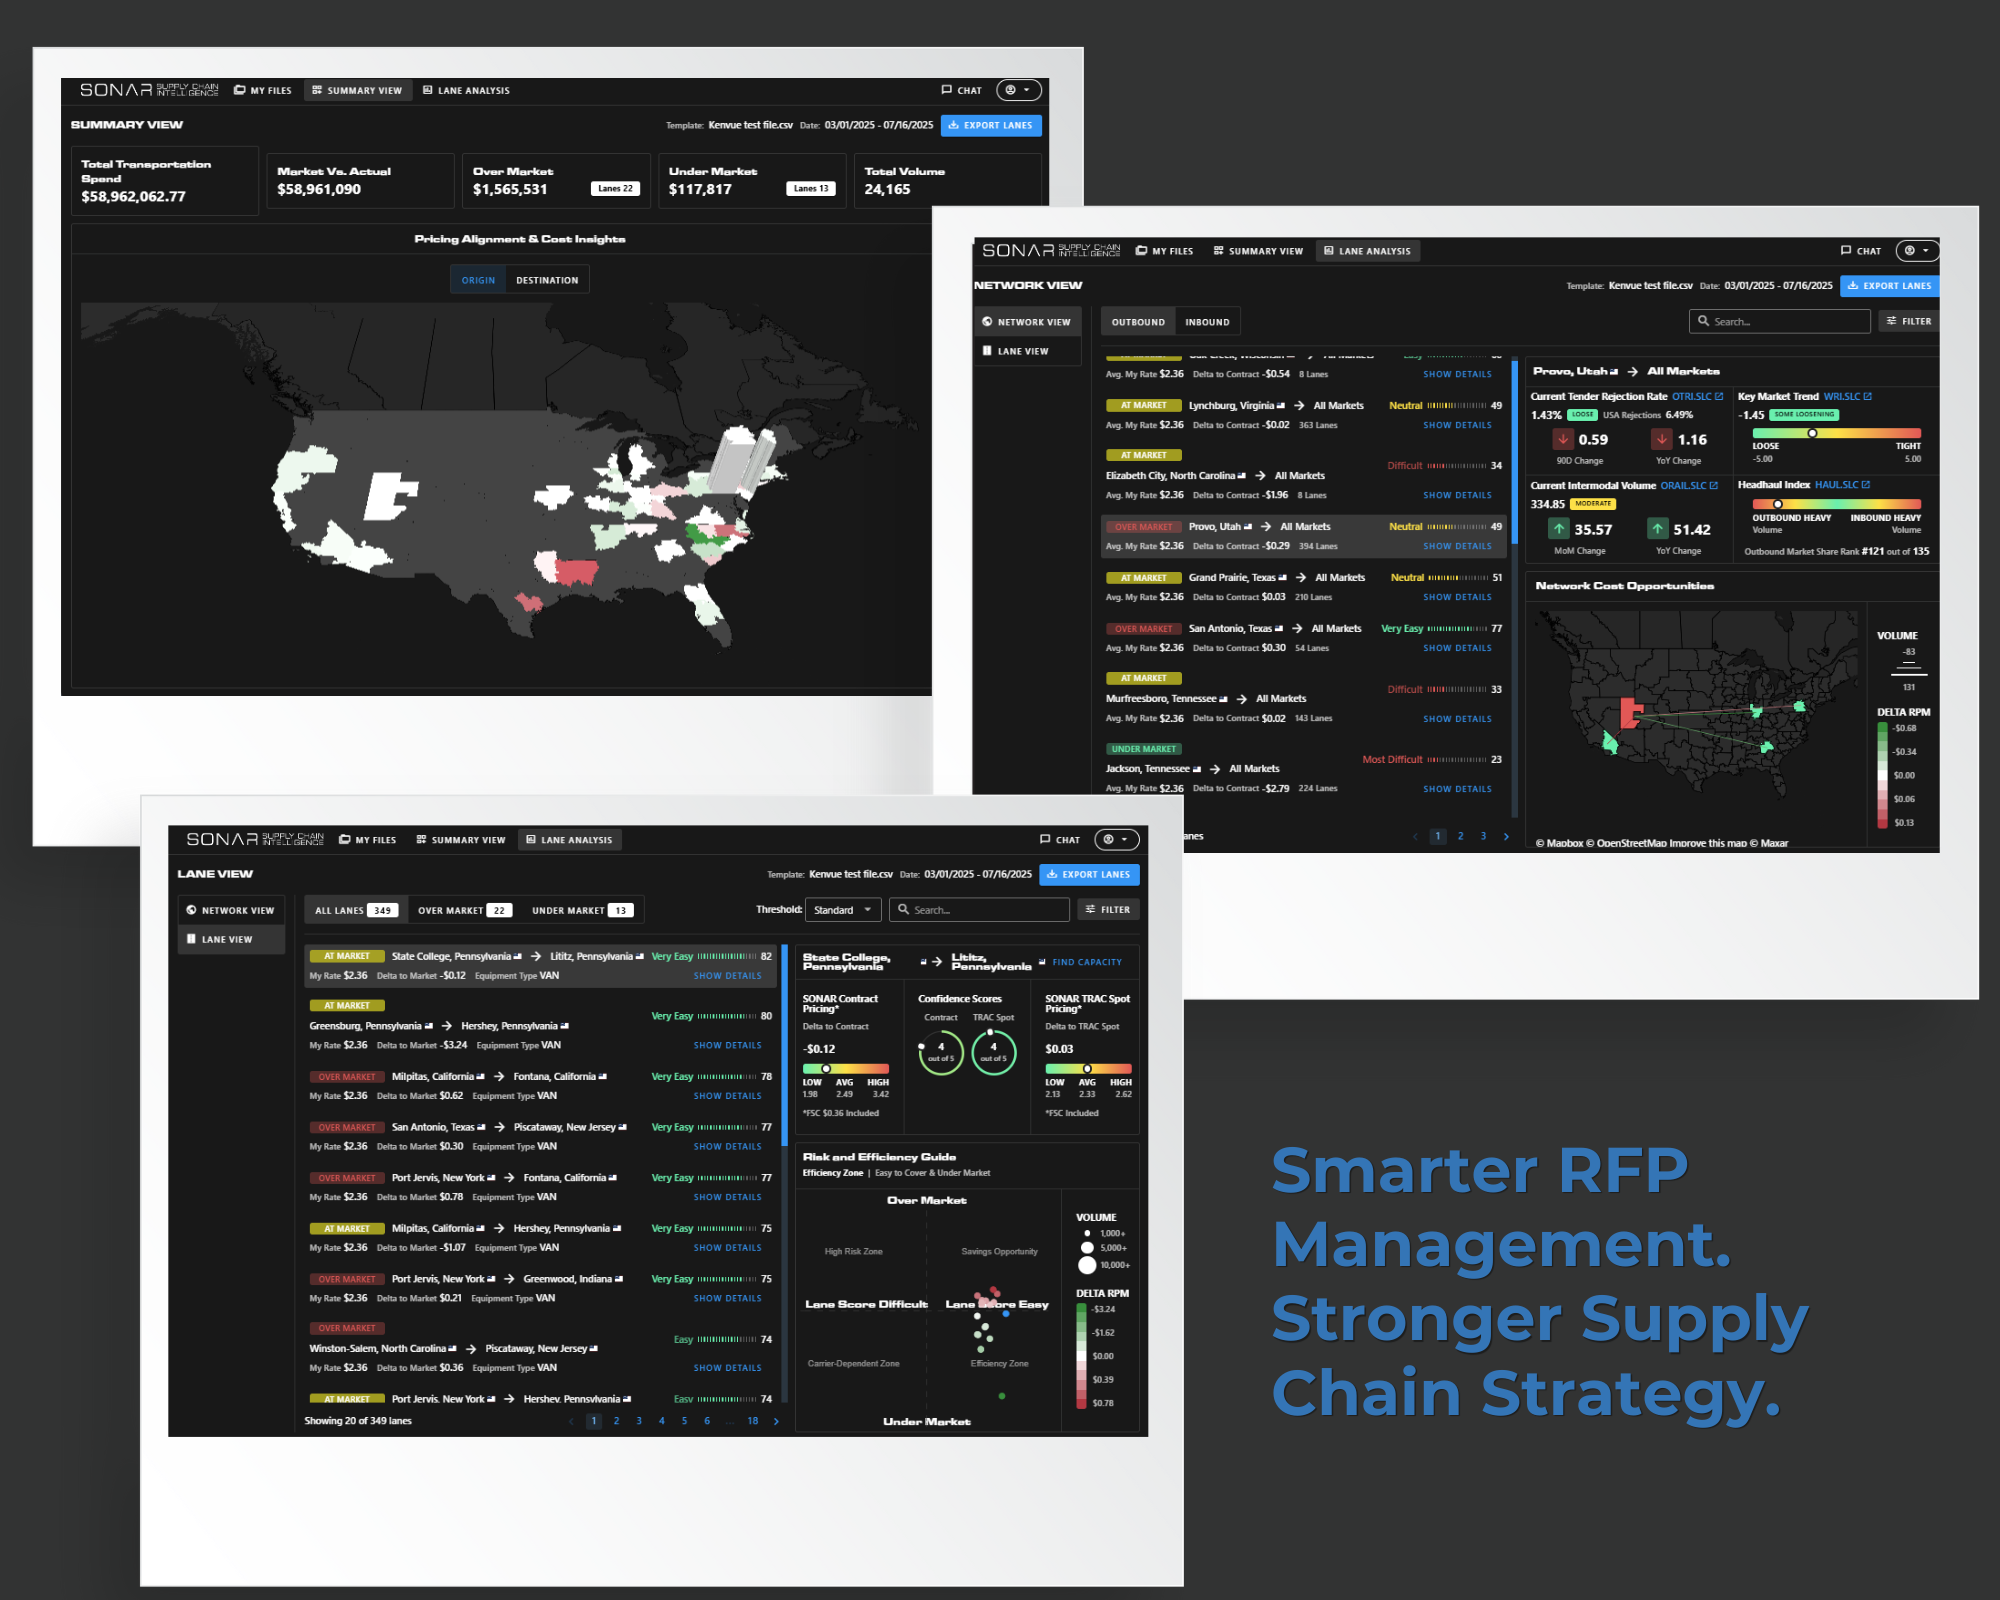
SCI is a dynamic freight analysis and strategy platform purpose-built for shippers who want to transform raw transportation data into actionable insight. By combining your lane-level rate and volume data with SONAR’s industry-leading market benchmarks, SCI helps you uncover hidden cost opportunities, evaluate compliance risk, and drive smarter procurement decisions—all within a unified, interactive workspace.

From high-level overviews to granular lane diagnostics, SCI allows you to understand your network like never before.
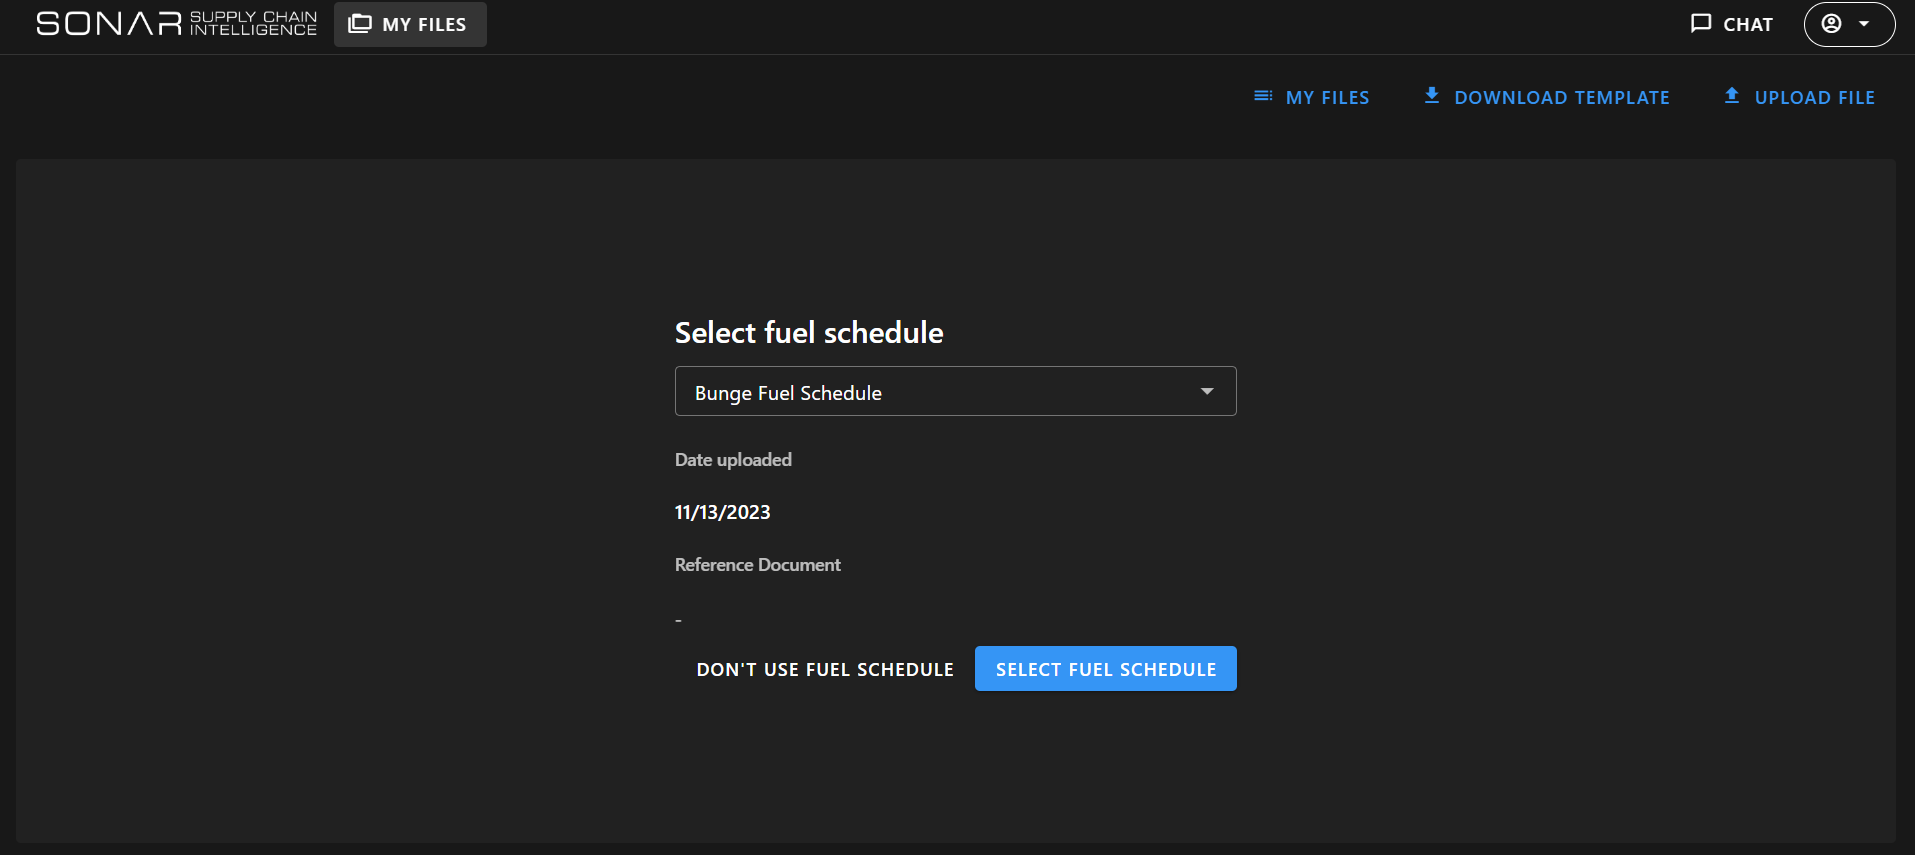
Fuel Schedules : 

Fuel schedules are meant to provide users with the ability to incorporate custom fuel surcharges into their rates when doing a benchmark analysis of their lanes. If you choose to not use or upload a fuel schedule we will calculate the Fuel Surcharge based on this formula -> (DOE.USA – $1.20) / 6.5mpg = fuel_surcharge_rpm

Selecting a Fuel Schedule

  • Once a Fuel Schedule(s) has been uploaded to an Organization, there will be a new step in the benchmark analysis workflow after the analysis date range is entered prompting you to select a Fuel Schedule to use in the analysis.
  • Using a Fuel Schedule is optional even if there are Fuel Schedules associated with the Organization. If you click ‘Don’t Use a Fuel Schedule’ the remaining steps will be skipped and your analysis will be started. When viewing your analysis in the application, you will see ‘Fuel Not Included’ beneath your rate and the ‘My Fuel Cost’ columns in the data downloads will be blank.
  • All active Fuel Schedules will show up in a drop-down list (sorted alphabetically) to choose from.
  • When a Fuel Schedule is selected, you will see the date is was uploaded and (if one exists) the reference file which you can click on to
    enlarge and download.


WHAT DOES IT TELL ME?

SCI surfaces key insights at three levels of analysis—each designed to help you take strategic action:

  • Summary View: Your landing page. See your total transportation spend, how it compares to market rates, and where you’re overpaying or at risk. An interactive cost alignment map shows which markets need immediate attention.
  • Network View: Group your data by origin or destination market (e.g., DCs, warehouses) to assess market-level performance. Identify problem areas, cost inefficiencies, and market conditions that influence capacity, cost, and carrier compliance.
  • Lane View: The most granular view. Evaluate every individual lane you’ve uploaded—benchmarking your rates against contract and spot markets, reviewing lane-specific guidance, and using the quadrant-based Risk and Efficiency Quadrant to support negotiations and strategy.


Across all views, SCI helps answer:

  • Where am I overpaying?
  • Where am I underpaying—and is it sustainable?
  • Which lanes or markets are driving cost or compliance issues?
  • Where can I improve routing guides or renegotiate with confidence?
  • How do my rates align with current market conditions?


In today’s fast-moving freight environment, relying on outdated assumptions or fragmented data can lead to costly mistakes. SCI empowers shippers with the clarity, confidence, and control needed to make smarter, faster decisions. By combining your internal data with real-time market benchmarks, SCI helps you proactively address inefficiencies, justify procurement strategies with data, strengthen carrier relationships through transparency, and build a more resilient and cost-effective supply chain. It turns reactive logistics into strategic advantage ensuring you stay ahead of the market.

WHO IS INTERESTED?

SCI is designed for shippers who are actively involved in:

  • Transportation Procurement
  • Supply Chain Strategy
  • Carrier Management
  • RFP & Lane Analysis
  • Logistics Operations
  • Sustainability and Network Optimization


It’s especially powerful for:

  • Shippers preparing for RFPs, re-bids or Mini-bids
  • Teams trying to reduce freight spend and improve routing guide performance
  • Strategic leaders needing data-driven justification for budget decisions or carrier strategy
  • Anyone looking to align operational execution with real-time market trends

HOW TO USE IT

The video below will give you a step by step tutorial on how to fill in the template for SCI.

For the full SCI 101 tutorial – coming soon.


Search Knowledge Center

Discover all that Supply Chain Intelligence (SCI) has to offer.

KC-Icon-App-SCI-Network

Network View

KC-Icon-App-SCI-Opportunity

Lane View

KC-Icon-App-SCI-Summary

Summary View

Choose Another App

carrier sales

Coverage Guide

download-17

Container Atlas

KC-Icon-App-Critical-Events

Critical Events

Customer Sales.jpg

Key Market Guidance

lane-signal-icon

Excel Add-In

KC-Icon-App-Market-Dashboard

Market Dashboard

lane-scorecard-icon

Market Dashboard+

market icon

Key Market Insights

container-atlas-icon

Most Volatile Markets

KC-Icon-App-SCI-List

National Insights

imports-by-consignee-icon

SONAR Charts

KC-Icon-App-SCI-Summary

SONAR Maps

predictive-rates-icon

Watchlists

Not Sure Where To Start?