Pre-Built SONAR Pages

Screenshot 2023-12-07 at 10.17.52 AM
US Summary Page

This page provides year over year volumes on national level, year over year rejections on national level, U.S. volume overlay with rejections, OTRI vs NTI rates and correlation, length of haul rejections on national level and more.

image (19)
Flatbed Page

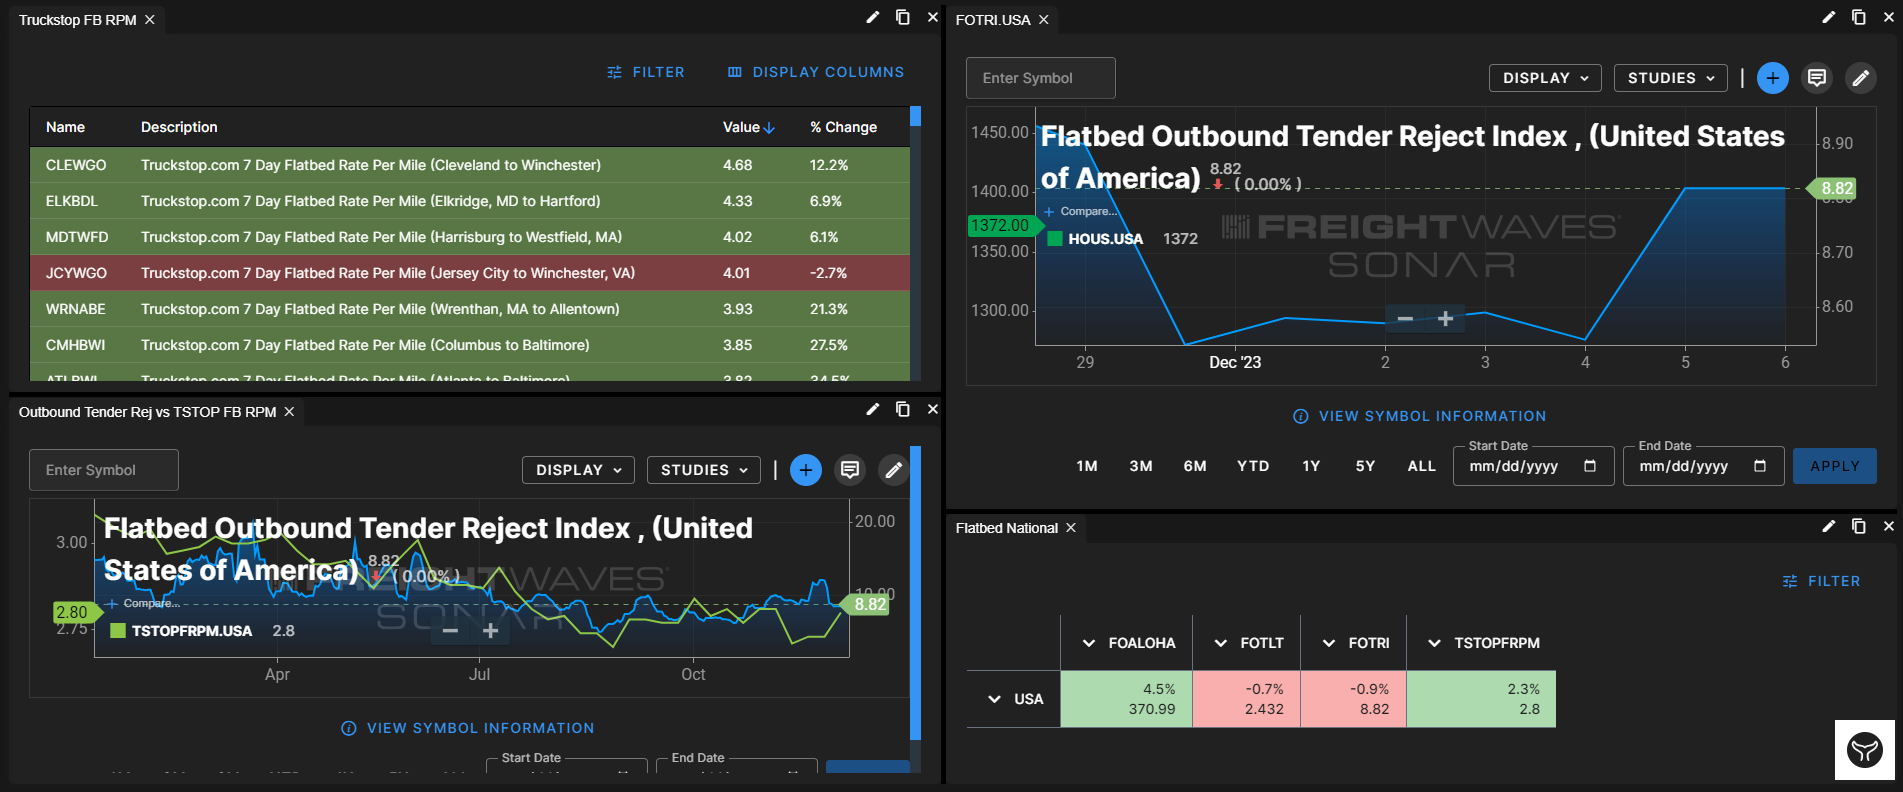
Top Left Watchlist: Truckstop.com Flatbed Lane Rates

Top Right Chart: Flatbed Rejections compared to Housing Starts

Bottom Left Chart: Flatbed Rejections compared to Truckstop.com National Average Rate

Bottom Right Chart: Flatbed Average Length of Haul, Flatbed Outbound Tender Lead Time, Flatbed Outbound Tender Reject Index, Truckstop.com National Average Rate

Screenshot 2023-12-07 at 10.18.48 AM
All About HAUL / Load Balance

Headhaul is great to view capacity in the market. Blue markets mean more outbound volume (loads) / Red markets mean more inbound volume (trucks).

Tab 1 - Map - All Modes HAUL
Tab 2 - Map - Van HAUL
Tab 3 - Map - Reefer HAUL
Tab 4 - Chart - OTVI.ATL (outbound volume) / ITVI.ATL (inbound volume)

Screenshot 2023-12-07 at 10.20.01 AM
Capacity Trend

How to identify loosening and tightening markets

Right: Capacity Trend Direction - measurement of the strength and direction of changes in capacity on a scale of -3 (strongest tightening) to +3 (strongest easing)
Left Tab 1 : Capacity Trend Scores (1= loose / 100= tight) - Sort by Value, the color indicates the day over day change. If it is red, that means it has gone down (moore loose), and if it is green, it has gone up(more tight)
Left Tab 2 - Volatility Widget -You can see the high highs and the low lows in the markets with OTVI, OTRI, Headhaul, and TLT

Not Sure Where To Start?